最近遇到这个案例大量FG prorcess堵塞,19c (19.4) 2nodes RAC, 等待Library Cache Load Lock, 最终的堵塞会话为REC0 后台进程, 该进程等待gc cr block lost. 该事件并不常见,相似的event 还可能有gc current block lost, 仅发生在ORACLE RAC环境,当前台进程发送包给远程节点的LMSn进程,并没有及时的得到反馈时记录该事件,而可能会堵塞其它会话,产生其它等待事件,也可能是ENQ SQ或gc xx acquire等,瞬间产生连接数耗尽等现象。
Top 10 Foreground Events by Total Wait Time
| Event | Waits | Total Wait Time (sec) | Avg Wait | % DB time | Wait Class |
|---|---|---|---|---|---|
| library cache load lock | 1,781 | 156.1K | 87.62 s | 81.6 | Concurrency |
| DB CPU | 30K | 15.7 | |||
| db file sequential read | 344,960 | 1953.4 | 5.66ms | 1.0 | User I/O |
| gc buffer busy acquire | 143,177 | 1100.5 | 7.69ms | .6 | Cluster |
| read by other session | 67,249 | 655.8 | 9.75ms | .3 | User I/O |
| log file sync | 593,781 | 618.7 | 1.04ms | .3 | Commit |
| db file parallel read | 12,208 | 231.9 | 19.00ms | .1 | User I/O |
| row cache mutex | 61,341 | 165.3 | 2.69ms | .1 | Concurrency |
| gc cr block 2-way | 351,188 | 121.9 | 347.17us | .1 | Cluster |
| PGA memory operation | 4,045,614 | 120.3 | 29.75us | .1 | Other |
Time Model Statistics
- DB Time represents total time in user calls
- DB CPU represents CPU time of foreground processes
- Total CPU Time represents foreground and background processes
- Statistics including the word “background” measure background process time, therefore do not contribute to the DB time statistic
- Ordered by % of DB time in descending order, followed by Statistic Name
| Statistic Name | Time (s) | % of DB Time | % of Total CPU Time |
|---|---|---|---|
| connection management call elapsed time | 156,106.57 | 81.62 | |
| DB CPU | 30,006.52 | 15.69 | 84.25 |
| sql execute elapsed time | 24,763.90 | 12.95 | |
| parse time elapsed | 10,144.13 | 5.30 | |
| hard parse elapsed time | 9,306.45 | 4.87 | |
| RMAN cpu time (backup/restore) | 3,508.68 | 1.83 | 9.85 |
Top Event P1/P2/P3 Values
- Top Events by DB Time and the top P1/P2/P3 values for those events.
- % Event is the percentage of DB Time due to the event
- % Activity is the percentage of DB Time due to the event with the given P1,P2,P3 Values.
| Event | % Event | P1, P2, P3 Values | % Activity | Parameter 1 | Parameter 2 | Parameter 3 |
|---|---|---|---|---|---|---|
| library cache load lock | 75.08 | “15123211520”,”5803580152″,”4521987″ | 1.06 | object address | lock address | 100*mask+namespace |
|
library cache load lock
|
75.07571023410085083882132384752199202038
|
“15123211520”,”9764512168″,”4521987″ | 1.06 |
object address
|
lock address
|
100*mask+namespace
|
|
library cache load lock
|
75.07571023410085083882132384752199202038
|
“15123211520”,”12033336408″,”4521987″ | 1.05 |
object address
|
lock address
|
100*mask+namespace
|
| gc buffer busy acquire | 1.43 | “1”,”121″,”1″ | 0.85 | file# | block# | class |
| Per Second | Per Transaction | |
|---|---|---|
| Global Cache blocks received: | 264.39 | 1.62 |
| Global Cache blocks served: | 302.74 | 1.85 |
| GCS/GES messages received: | 2,611.29 | 15.97 |
| GCS/GES messages sent: | 2,179.36 | 13.33 |
| DBWR Fusion writes: | 2.18 | 0.01 |
| Estd Interconnect traffic (KB) | 19,083.79 |
Global Cache and Enqueue Services – Workload Characteristics
| Avg global cache cr block receive time (us): | 427.7 |
| Avg global cache current block receive time (us): | 483.1 |
| Avg LMS process busy %: | 1.8 |
| Avg global cache cr block build time (us): | 26.9 |
| Global cache log flushes for cr blocks served %: | 0.8 |
| Avg global cache cr block flush time (us): | 1,045.1 |
| Avg global cache current block pin time (us): | 535.7 |
| Global cache log flushes for current blocks served %: | 0.7 |
| Avg global cache current block flush time (us): | 2,075.0 |
| Avg global enqueue get time (us): | 0.0 |
Global Cache and Enqueue Services – Messaging Statistics
| Avg message sent queue time (us): | 1,255.4 |
| Avg message sent queue time on ksxp (us): | 228.5 |
| Avg message received kernel queue time (us): | 2.0 |
| Avg message received queue time (us): | 3.4 |
| Avg GCS message process time (us): | 16.8 |
| Avg GES message process time (us): | 8.4 |
| % of direct sent messages: | 46.35 |
| % of indirect sent messages: | 53.60 |
| % of flow controlled messages: | 0.05 |
Note:
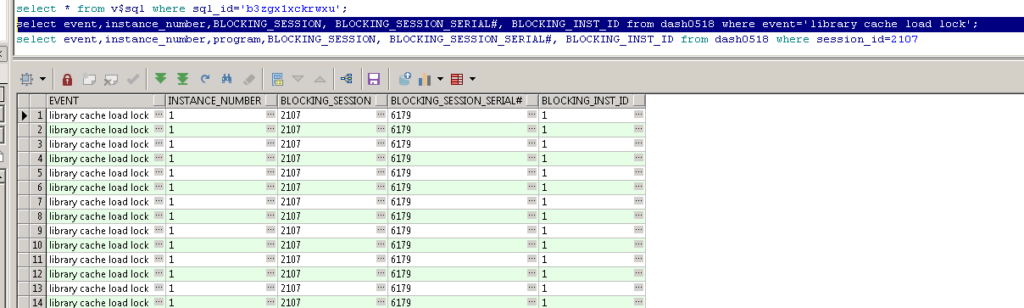
显示堵塞者为node1 的session 2107.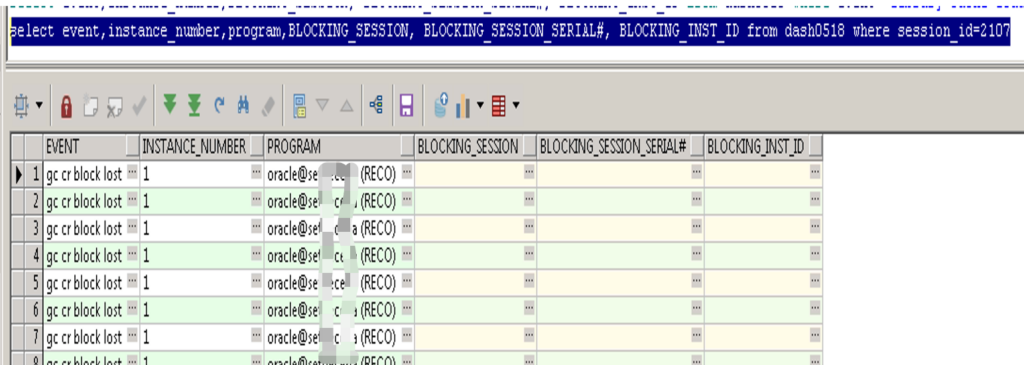
Note:
显示session 2107没有被堵塞,但是等待gc cr block lost.并且堵塞进程为REC0, 上一篇blog 刚遇到REC0堵塞的故障, REC0为分布式事务回滚后台进程。
Library Cache Load Lock
A session tries to obtain a library cache load lock for a database object so that it can load it into the library cache. When a session is experiencing this form of lock, there is another session that has the load lock for the same object. No other process can load the same object into the library cache, as the load lock is always obtained in exclusive mode.
gc cr block Lost
Probably, the most critical statistics for interconnect issues. Consistent high amount of ‘gc blocks lost’ is an indication of problem with underlying network infrastructure. (Hardware, firmware etc). Ideal value is near zero. But, only worry about this, if there are consistently higher values.If there is no response to a request within 0.5 seconds(_side_channel_batch_timeout_ms parameter control), then the block is declared lost and the lost block–related statistics are incremented. Reasons for lost block error condition include CPU scheduling issues, incorrect network buffer configuration, resource shortage in the server, network configuration issues, etc.
- ‘gc cr block lost’或’gc current block lost’成为实例中Top 5的主要等待事件
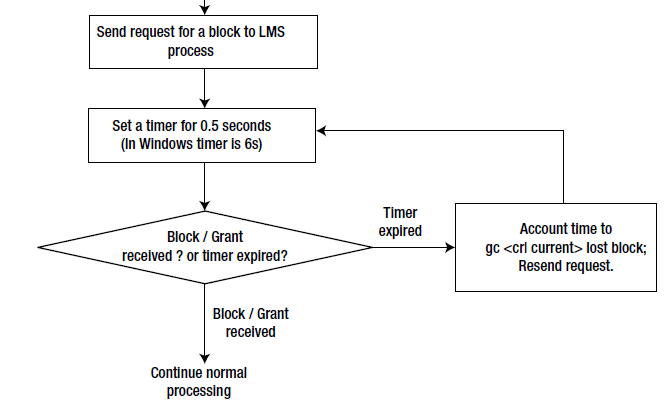
Oracle RAC 使用如上图 所示的算法来检测丢失的块。 首先,前台进程向远程节点中运行的 LMS 进程发送请求。 在收到来自 LMS 进程的响应之前,前台进程无法继续。 因此,前台进程设置一个到期时间为0.5秒的计时器(在Windows平台中,该计时器到期时间设置为6秒)并进入睡眠状态。 如果前台进程接收到块/读取块的授权,则前台进程将继续处理。 如果在 0.5 秒的时间间隔内没有收到响应,则警报将唤醒前台进程,该进程将声明该块丢失,并记入等待时间到 gc cr block lost 或 gc current block losed。 前台进程将向LMS进程重新提交访问同一块的请求。 如果发送或接收块时出现问题,前台进程可能会陷入等待此循环中的块的状态。
通常伴随:
- SQL trace报告显示多次出现gc cr requests,gc current request等待事件
- 出现长时间的gc cr multiblock requests等待
- 糟糕的应用性能与吞吐量
- ifconfig或其他网络工具显示存在大量的网络包packet发送接收(send/receive)错误
- netstat报告显示存在errors/retransmits/reassembly等失败
- 单个或多个节点失败
- 由网络处理引发的异常CPU使用率
常见原因
1, 私网相关的硬件问题,如交换机、网卡
2, 网络参数配置不合理,如MTU,重组buffer size,rmem_max 和 wmem_max
3, 网络负载高带宽不足,如流量大、交换机busy
4,防火墙设备配置
5,操作系统CPU负载过高,导致网络延迟或应用处理慢,产生UDP重组或overflow drop
6,内存使用率高,UDP buffer 不足
7, LMS进程busy, 私网流量大,LMS 进程不足
8,Oracle BUG
检查IP包重组失败
LINUX 6
netstat -s |grep reass
-sleep 5sec
netstat -s |grep reass

LINUX 7
nstat -az|grep IpReasmFails
-sleep 5sec
nstat -az|grep IpReasmFails
被堵塞的会话SQL为
select host,userid,password,flag,authusr,authpwd, passwordx, authpwdx from link$ where owner#=:1 and name=:2
Note:
与dblink 相关的分布式事务.
查找gc cr block lost 会话
 select  to_char(SAMPLE_TIME,'yyyymmdd hh24:mi:ss')  etime,instance_number||':'||SESSION_ID||':'||session_serial# sesid,
  SESSION_TYPE,IS_SQLID_CURRENT,SQL_EXEC_START,EVENT,SEQ#,WAIT_TIME,SESSION_STATE,
  TIME_WAITED,BLOCKING_INST_ID||':'||BLOCKING_SESSION||':'||BLOCKING_SESSION_SERIAL# bsesid,program,MACHINE,sql_id
  from system.ASH20240302
  where   event='gc cr block lost'
— 查到当前的session id, 去DIAG/trace 目录查找当前进程对应在的trace, e.g. SESSION_ID=100 session_serial#=200
find . -type f -name "*.trc" -mtime -1 -exec grep "SESSION ID:(100.200)" {} \;

find . -type f -newermt "2021-01-01 10:00:00" ! -newermt "2021-01-01 12:00:00" -exec grep "SESSION ID:(100.200)" {} \;
find(1):
find ./ -mtime +n used to get all files older than n days
find ./ -mtime -n used to get all files modified in last n daysNow if you are using 1 in place of n, you will get files modified in the last 24 hours. But what if you want only files from yesterday and not within the last 24 hours? Here newermt comes into the picture.
-newerXY reference
Compares the timestamp of the current file with reference. Thereference argument is normally the name of a file (and one of
its timestamps is used for the comparison) but it may also be a string describing an absolute time. X and Y are placeholders
for other letters, and these letters select which time belonging to how reference is used for the comparison.a The access time of the file reference
B The birth time of the file reference
c The inode status change time of reference
m The modification time of the file reference
t reference is interpreted directly as a time
查看rec0 trace file
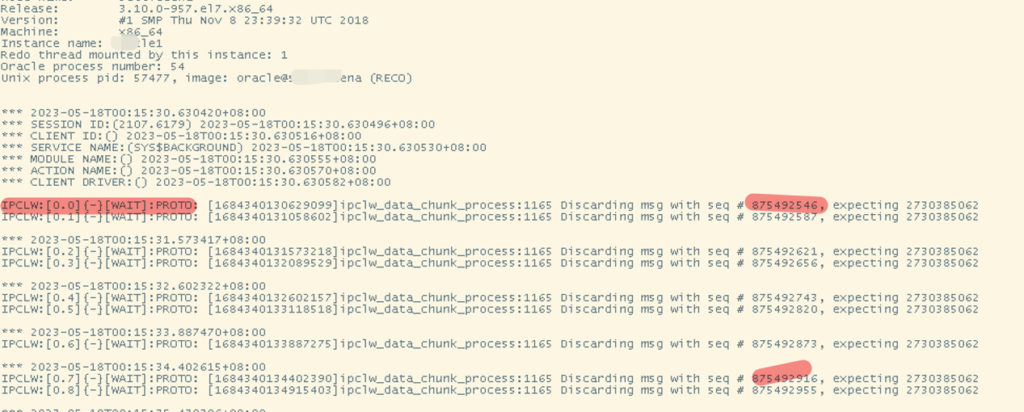
IPCLW:[0.0]{-}[WAIT]:PROTO: [1661188358080974]ipclw_data_chunk_process:1165 Discarding msg with seq # 875492546, expecting 2730385062
IPCLW:[0.0]{-}[WAIT]:PROTO: [1661188358080974]ipclw_data_chunk_process:1165 Discarding msg with seq # 875492587, expecting 2730385062

IPCLW:[0.0]{-}[WAIT]:PROTO: [1661188358080974]ipclw_data_chunk_process:1165 Discarding msg with seq # 875492621, expecting 2730385062
IPCLW:[0.0]{-}[WAIT]:PROTO: [1661188358080974]ipclw_data_chunk_process:1165 Discarding msg with seq # 875492656, expecting 2730385062

IPCLW:[0.0]{-}[WAIT]:PROTO: [1661188358080974]ipclw_data_chunk_process:1165 Discarding msg with seq # 875492743, expecting 2730385062
IPCLW:[0.0]{-}[WAIT]:PROTO: [1661188358080974]ipclw_data_chunk_process:1165 Discarding msg with seq # 875492820, expecting 2730385062
Note:
发生在ipclw层,丢弃的消息比逾期的要差很远。
相关的已知bug
Bug 33676842 – Invalid Message Discarding ‘gc block lost’ Cause Waiting For ‘gc cr request’ and Subsequent DB Open Time Out (Doc ID 33676842.8)
Bug 34482043 Some “gc cr multi block mixed” wait outliers cause a performance regression in 19c
FG traces show IPCLW discarding messages with older sequence number than the expected.
Bug 34473784 : INSERT STATEMENT IS HANGED BY “GC CURRENT/CR BLOCK LOST”
Bug 32685989 PX Slave Session Hang While Waiting For ‘gc cr request’, ‘gc cr block lost’ continuously
OSW
Oswatcher netstat output to see if we are seeing packet drops/reassembly failures
	行 29:     144743 packet reassembles failed
	行 190:     144745 packet reassembles failed
	行 351:     144745 packet reassembles failed
	行 512:     144746 packet reassembles failed
	行 673:     144749 packet reassembles failed
	行 834:     144750 packet reassembles failed
	行 995:     144752 packet reassembles failed
	行 1156:     144754 packet reassembles failed
	行 1317:     144755 packet reassembles failed
当时有IP packt包重组失败。
分析OSW
- Vmstat and Top log file : It would indicate if there is High CPU issues
- Traceroute log file : It would indicate’***’ when there is Network hang around the issue time
- Netstat Log file : It would indicate trend of Increase in Below Values
sed  -n '/2 18:10/,/2 18:14/p' xxx_netstat_xxx.dat|egrep -i '^zzz|fail|los|err|retran|reass|drop|Overflow'|awk ' $2 != 0  {print $0}' |egrep -v 'RX|TX'

awk '/zzz/{d=$3"/"$4" "$5}/IpReasmFails/{curr=$2;diff=curr-prev;if(diff>5)print d,diff,prev,curr;prev=curr}' *.dat
IP :
| Observation | Issue |
| bad header checksum or fragments dropped packet | corruption or the device drivers queue are not large enough |
| packet reassemblies failed | probable asymmetric routing and firewall is enabled |
| retransmits failed | network saturation or Incorrect network configuration |
| fragments dropped after timeout | network is busy probably due to network saturation |
UDP :
| Observation | Issue |
| socket buffer overflows | Insufficient transmit and receive UDP socket |
| packet receive errors | hardware or UDP Parameter configuration issue with Private Interconnect |
| bad checksums | issues with Hardware Card or Faulty Cable |
相关诊断
# IPCLW traces should then be enabled for diagnosis using below command:
 ALTER SYSTEM SET events='ipclw_trace level=5, flag=0xFFFFFFFF';

# check MTU SIZE

# TEST CASE
- _lm_comm_channel='msgq_udp'
- db_block_size = 16384
- db_file_multiblock_read_count = 64 (default)
# node1
create table test_gc (aaa varchar(100 char)) nocompress;
set timing on
insert into test_gc
select
'bbbbbbbbbbbbbbbbbbbbbbbbbbbbbbbbbbbbbbbbbbbbbbbbbbbbbbbbbbbbbbbbbbbbb'
from dual connect by level <= 1000000 ;

commit;

# node2
alter session set events '10046 trace name context forever, level 12';
-- alter session set db_file_multiblock_read_count=1;

set timing on
select /*+ monitor */ count(*) from test_gc;
监控gc block lost
select a.inst_id "instance", a.value "gc blocks lost",
b.value "gc cur blocks served",
c.value "gc cr blocks served",
a.value/(b.value+c.value) ratio
from gv$sysstat a, gv$sysstat b, gv$sysstat c
where a.name='gc blocks lost' and
b.name='gc current blocks served' and
c.name='gc cr blocks served' and
b.inst_id=a.inst_id and
c.inst_id = a.inst_id ;

select
inst_id,
event,
total_waits,
time_waited
from
gv$system_event
where
event in ('gc current block lost','gc cr block lost')
order by
inst_id, total_waits desc;

select * from gv$instance_cache_transfter ;
可能的解决方案
1. 对于Bug 34482043原因是在IPCLW中丢弃无序消息会导致CR lost block。只有在接收到默认情况下在500毫秒后发送的侧信道消息后,才会再次请求该块。修改方向 Deliver out of order messages if they are received within a certain window size. 安装对应的one off patch
2. increasing the IP reassembly buffers and timeout in the kernel.
3. kill REC0 process (waited gc cr block lost process)