最近有个银行客户咨询,他们一个系统有个SQL在凌晨1点左右执行计划突然变差了,数据库为oracle 11.2.0.4 RAC, 从AWR看数据库该时段实例级几乎空闲,上线很久的业务,问题时间点无人为操作,SQL特征是查询一个分区表,2个列上查询条件,并不包含分区键列, 其中有一个列使用了绑定变量,执行计划有原来使用绑定变量列的索引改为全表分区扫描,直到白天10点以后人为收集了统计信息恢复正常。 简单记录如下
AWR 问题时间点负载
| Snap Id | Snap Time | Sessions | Cursors/Session | Instances | |
|---|---|---|---|---|---|
| Begin Snap: | 70734 | 06-May-23 01:00:09 | 110 | 5.6 | 2 |
| End Snap: | 70735 | 06-May-23 01:30:12 | 113 | 5.8 | 2 |
| Elapsed: | 30.06 (mins) | ||||
| DB Time: | 14.19 (mins) |
SQL执行计划历史
从SQLHC中可以获取以下信息
Historical SQL Statistics – Delta (DBA_HIST_SQLSTAT)
Performance metrics of Execution Plans of 4ruhsafdgfj0x.
This section includes data captured by AWR. If this is a stand-by read-only database then the AWR information below is from the Primary database.
| # | Snap ID |
Snaphot | Inst ID |
Plan HV | Vers Cnt |
Execs | Fetch | Loads | Inval | Parse Calls |
Buffer Gets |
Disk Reads |
Direct Writes |
Rows Proc |
Elapsed Time (secs) |
CPU Time (secs) |
IO Time (secs) |
Conc Time (secs) |
Appl Time (secs) |
Clus Time (secs) |
PLSQL Time (secs) |
Java Time (secs) |
Optimizer Mode |
Cost | Opt Env HV | Parsing Schema Name |
Module | Action | Profile |
|---|---|---|---|---|---|---|---|---|---|---|---|---|---|---|---|---|---|---|---|---|---|---|---|---|---|---|---|---|---|
| 42 | 70446 | 2023-04-30/01:00:30 | 2 | 1429561684 | 1 | 4 | 3 | 0 | 0 | 4 | 466106 | 5041 | 0 | 3 | 30.131 | 2.554 | 20.120 | 0.000 | 0.000 | 8.151 | 0.000 | 0.000 | ALL_ROWS | 138524 | 642354766 | USR | JDBC Thin Client | ||
| 43 | 70447 | 2023-04-30/01:30:03 | 2 | 1429561684 | 1 | 413 | 414 | 0 | 0 | 413 | 4651023 | 255743 | 0 | 414 | 807.680 | 67.347 | 482.346 | 0.000 | 0.000 | 283.310 | 0.000 | 0.000 | ALL_ROWS | 138524 | 642354766 | USR | JDBC Thin Client | ||
| 44 | 70494 | 2023-05-01/01:00:12 | 2 | 1429561684 | 1 | 4 | 3 | 0 | 0 | 4 | 466519 | 2297 | 0 | 3 | 12.578 | 1.410 | 10.190 | 0.000 | 0.000 | 1.121 | 0.000 | 0.000 | ALL_ROWS | 138524 | 642354766 | USR | JDBC Thin Client | ||
| 45 | 70495 | 2023-05-01/01:30:19 | 2 | 1429561684 | 1 | 413 | 414 | 0 | 0 | 413 | 4652526 | 84065 | 0 | 414 | 135.009 | 20.475 | 95.321 | 0.000 | 0.000 | 22.211 | 0.000 | 0.000 | ALL_ROWS | 138524 | 642354766 | USR | JDBC Thin Client | ||
| 46 | 70542 | 2023-05-02/01:00:40 | 1 | 1429561684 | 1 | 4 | 3 | 0 | 0 | 4 | 473338 | 6152 | 0 | 3 | 35.516 | 5.871 | 25.837 | 0.000 | 0.000 | 5.443 | 0.000 | 0.000 | ALL_ROWS | 138524 | 642354766 | USR | JDBC Thin Client | ||
| 47 | 70543 | 2023-05-02/01:30:44 | 1 | 1429561684 | 1 | 369 | 370 | 0 | 0 | 369 | 4644657 | 523841 | 0 | 370 | 876.644 | 156.018 | 658.911 | 0.000 | 0.000 | 117.955 | 0.000 | 0.000 | ALL_ROWS | 138524 | 642354766 | USR | JDBC Thin Client | ||
| 48 | 70590 | 2023-05-03/01:00:04 | 2 | 1429561684 | 1 | 1 | 0 | 0 | 0 | 1 | 90420 | 729 | 0 | 0 | 3.197 | 0.246 | 2.904 | 0.000 | 0.000 | 0.068 | 0.000 | 0.000 | ALL_ROWS | 138524 | 642354766 | USR | JDBC Thin Client | ||
| 49 | 70591 | 2023-05-03/01:30:17 | 2 | 1429561684 | 1 | 416 | 417 | 0 | 0 | 416 | 5004051 | 316980 | 0 | 417 | 828.918 | 63.491 | 553.742 | 0.000 | 0.000 | 234.327 | 0.000 | 0.000 | ALL_ROWS | 138524 | 642354766 | USR | JDBC Thin Client | ||
| 50 | 70638 | 2023-05-04/01:00:28 | 1 | 1429561684 | 1 | 4 | 3 | 0 | 0 | 4 | 455614 | 5548 | 0 | 3 | 27.518 | 5.166 | 19.182 | 0.000 | 0.000 | 4.471 | 0.000 | 0.000 | ALL_ROWS | 135832 | 642354766 | USR | JDBC Thin Client | ||
| 51 | 70639 | 2023-05-04/01:30:39 | 1 | 1429561684 | 1 | 413 | 414 | 0 | 0 | 413 | 4689575 | 293773 | 0 | 414 | 787.993 | 149.052 | 526.241 | 0.000 | 0.000 | 167.868 | 0.000 | 0.000 | ALL_ROWS | 135832 | 642354766 | USR | JDBC Thin Client | ||
| 52 | 70686 | 2023-05-05/01:00:05 | 2 | 1429561684 | 1 | 4 | 3 | 0 | 0 | 4 | 419394 | 1871 | 0 | 3 | 4.713 | 1.230 | 3.296 | 0.000 | 0.000 | 0.249 | 0.000 | 0.000 | ALL_ROWS | 135832 | 642354766 | USR | JDBC Thin Client | ||
| 53 | 70687 | 2023-05-05/01:30:12 | 2 | 1429561684 | 1 | 413 | 414 | 0 | 0 | 413 | 4736621 | 658419 | 0 | 414 | 900.719 | 65.645 | 732.501 | 0.000 | 0.000 | 125.709 | 0.000 | 0.000 | ALL_ROWS | 135832 | 642354766 | USR | JDBC Thin Client | ||
| 54 | 70734 | 2023-05-06/01:00:09 | 1 | 1429561684 | 1 | 1 | 0 | 0 | 0 | 1 | 108909 | 0 | 0 | 0 | 9.698 | 3.649 | 0.000 | 0.000 | 0.000 | 7.581 | 0.000 | 0.000 | ALL_ROWS | 135832 | 642354766 | USR | JDBC Thin Client | ||
| 55 | 70735 | 2023-05-06/01:30:12 | 1 | 1429561684 | 1 | 5 | 6 | 0 | 0 | 5 | 502520 | 41371 | 0 | 6 | 129.674 | 15.249 | 104.611 | 0.000 | 0.000 | 15.527 | 0.000 | 0.000 | ALL_ROWS | 135832 | 642354766 | USR | JDBC Thin Client | ||
| 56 | 70735 | 2023-05-06/01:30:12 | 2 | 1634677993 | 1 | 2 | 1 | 0 | 0 | 2 | 5011570 | 2053940 | 0 | 1 | 1669.041 | 110.873 | 1417.607 | 0.000 | 0.000 | 172.850 | 0.000 | 0.000 | ALL_ROWS | 740643 | 642354766 | USR | JDBC Thin Client | ||
| 57 | 70736 | 2023-05-06/02:00:19 | 2 | 1634677993 | 1 | 4 | 4 | 0 | 0 | 4 | 8814702 | 3512366 | 0 | 4 | 1804.871 | 187.616 | 1368.072 | 0.000 | 0.000 | 303.651 | 0.000 | 0.000 | ALL_ROWS | 740643 | 642354766 | USR | JDBC Thin Client | ||
| 58 | 70737 | 2023-05-06/02:30:32 | 2 | 1634677993 | 1 | 5 | 5 | 0 | 0 | 5 | 13510593 | 5394886 | 0 | 5 | 1812.430 | 291.556 | 1141.191 | 0.000 | 0.000 | 464.778 | 0.000 | 0.000 | ALL_ROWS | 740643 | 642354766 | USR | JDBC Thin Client | ||
| 59 | 70738 | 2023-05-06/03:00:08 | 2 | 1634677993 | 1 | 2 | 2 | 0 | 0 | 2 | 5496986 | 2193826 | 0 | 2 | 1776.219 | 121.269 | 1503.133 | 0.000 | 0.000 | 187.383 | 0.000 | 0.000 | ALL_ROWS | 740643 | 642354766 | USR | JDBC Thin Client |
Note:
从以上可以确认是在2023-05-06/01:30前从实例2开始执行的SQL执行计划发生改变,逻辑读和响应时间翻了近10倍。平时SQL的执行次数并不多,so,你懂得
查看两个执行计划
Inst: 2   Child: 0    Plan hash value: 1429561684

                      --------------------------------------------------------------------------------------------------------------------------
                      | Id  | Operation                           | Name              | E-Rows |E-Bytes| Cost (%CPU)| E-Time   | Pstart| Pstop |
                      --------------------------------------------------------------------------------------------------------------------------
                      |   0 | SELECT STATEMENT                    |                   |        |       |  1058 (100)|          |       |       |
                      |   1 |  SORT AGGREGATE                     |                   |      1 |    27 |            |          |       |       |
                      |*  2 |   TABLE ACCESS BY GLOBAL INDEX ROWID| TAB_QWERTYUIOPAS  |    112 |  3024 |  1058   (0)| 00:00:13 | ROWID | ROWID |
                      |*  3 |    INDEX RANGE SCAN                 | INX_EXTXXX3       |   3634 |       |    19   (0)| 00:00:01 |       |       |
                      --------------------------------------------------------------------------------------------------------------------------
                      Query Block Name / Object Alias (identified by operation id):
                      -------------------------------------------------------------
                         1 - SEL$F5BB74E1
                         2 - SEL$F5BB74E1 / O@SEL$2
                         3 - SEL$F5BB74E1 / O@SEL$2
                      Outline Data
                      -------------
                        /*+
                            BEGIN_OUTLINE_DATA
                            IGNORE_OPTIM_EMBEDDED_HINTS
                            OPTIMIZER_FEATURES_ENABLE('11.2.0.4')
                            DB_VERSION('11.2.0.4')
                            OPT_PARAM('_b_tree_bitmap_plans' 'false')
                            OPT_PARAM('_bloom_filter_enabled' 'false')
                            OPT_PARAM('_optimizer_extended_cursor_sharing' 'none')
                            OPT_PARAM('_optimizer_extended_cursor_sharing_rel' 'none')
                            OPT_PARAM('_optimizer_adaptive_cursor_sharing' 'false')
                            OPT_PARAM('_optimizer_use_feedback' 'false')
                            ALL_ROWS
                            OUTLINE_LEAF(@"SEL$F5BB74E1")
                            MERGE(@"SEL$2")
                            OUTLINE(@"SEL$1")
                            OUTLINE(@"SEL$2")
                            INDEX_RS_ASC(@"SEL$F5BB74E1" "O"@"SEL$2" ("TAB_QWERTYUIOPAS"."EXTEND3"))
                            END_OUTLINE_DATA
                        */
                      Peeked Binds (identified by position):
                      --------------------------------------
                         1 - (VARCHAR2(30), CSID=852): '221125'
                    Predicate Information (identified by operation id):
                      ---------------------------------------------------
                         2 - filter(("O"."QUERYxxxx">='2023/03/01 00:00:00' AND "O"."QUERYxxxx"<='2023/03/31 00:00:00'))
                         3 - access("O"."Exxxx3"=:1)

Plan hash value: 1634677993

----------------------------------------------------------------------------------------------------------
| Id  | Operation            | Name              | Rows  | Bytes | Cost (%CPU)| Time     | Pstart| Pstop |
----------------------------------------------------------------------------------------------------------
|   0 | SELECT STATEMENT     |                   |       |       |   740K(100)|          |       |       |
|   1 |  SORT AGGREGATE      |                   |     1 |    27 |            |          |       |       |
|   2 |   PARTITION RANGE ALL|                   | 86226 |  2273K|   740K  (1)| 02:28:08 |     1 |     6 |
|   3 |    TABLE ACCESS FULL | TAB_QWERTYUIOPAS  | 86226 |  2273K|   740K  (1)| 02:28:08 |     1 |     6 |
----------------------------------------------------------------------------------------------------------

Query Block Name / Object Alias (identified by operation id):
-------------------------------------------------------------
   1 - SEL$F5BB74E1
   3 - SEL$F5BB74E1 / O@SEL$2
Outline Data
-------------
  /*+
      BEGIN_OUTLINE_DATA
      IGNORE_OPTIM_EMBEDDED_HINTS
      OPTIMIZER_FEATURES_ENABLE('11.2.0.4')
      DB_VERSION('11.2.0.4')
      OPT_PARAM('_b_tree_bitmap_plans' 'false')
      OPT_PARAM('_bloom_filter_enabled' 'false')
      OPT_PARAM('_optimizer_extended_cursor_sharing' 'none')
      OPT_PARAM('_optimizer_extended_cursor_sharing_rel' 'none')
      OPT_PARAM('_optimizer_adaptive_cursor_sharing' 'false')
      OPT_PARAM('_optimizer_use_feedback' 'false')
      ALL_ROWS
      OUTLINE_LEAF(@"SEL$F5BB74E1")
      MERGE(@"SEL$2")
      OUTLINE(@"SEL$1")
      OUTLINE(@"SEL$2")
      FULL(@"SEL$F5BB74E1" "O"@"SEL$2")
      END_OUTLINE_DATA
  */
Peeked Binds (identified by position):
--------------------------------------

   1 - :1 (VARCHAR2(30), CSID=852): '001358'
NOTE:
从上面我们可以看到确实有两个执行计划,同时当前是禁用了SQL ACS,但bind peek功能启用,记录下两个变量值及对应的两个执行计划。
通常首先需要排除问题时间是否表有DDL,或统计信息改变,因为无人为操作且从last_ddl_time可以排除,下面看统计信息历史。
统计信息历史版本
Tables Statistics Versions
| # | Table Name | Owner | Version Type | Save Time | Last Analyzed | Num Rows | Sample Size |
Perc | Blocks | Avg Row Len |
|---|---|---|---|---|---|---|---|---|---|---|
| 1 | TAB_QWERTYUIOPAS | USR | CURRENT | 06-MAY-2023 10:38:56 | 58870628 | 58870628 | 100.0 | 2734209 | 319 | |
| 2 | TAB_QWERTYUIOPAS | USR | HISTORY | 06-MAY-23 10.38.57.053620 AM +08:00 | 03-MAY-2023 19:33:02 | 58758724 | 58758724 | 100.0 | 2725002 | 319 |
| 3 | TAB_QWERTYUIOPAS | USR | HISTORY | 03-MAY-23 07.33.02.744252 PM +08:00 | 29-APR-2023 19:33:36 | 58580497 | 58580497 | 100.0 | 2716818 | 319 |
| 4 | TAB_QWERTYUIOPAS | USR | HISTORY | 29-APR-23 07.33.37.151765 PM +08:00 | 26-APR-2023 19:37:51 | 58493190 | 58493190 | 100.0 | 2716818 | 319 |
| 5 | TAB_QWERTYUIOPAS | USR | HISTORY | 26-APR-23 07.37.51.237423 PM +08:00 | 22-APR-2023 19:33:59 | 58316831 | 58316831 | 100.0 | 2708634 | 319 |
| 6 | TAB_QWERTYUIOPAS | USR | HISTORY | 22-APR-23 07.33.59.315324 PM +08:00 | 19-APR-2023 19:35:50 | 58152146 | 58152146 | 100.0 | 2700450 | 319 |
| 7 | TAB_QWERTYUIOPAS | USR | HISTORY | 19-APR-23 07.35.50.262460 PM +08:00 | 15-APR-2023 19:31:17 | 57964514 | 57964514 | 100.0 | 2692266 | 319 |
| 8 | TAB_QWERTYUIOPAS | USR | HISTORY | 15-APR-23 07.31.17.426153 PM +08:00 | 12-APR-2023 19:34:27 | 57816915 | 57816915 | 100.0 | 2684082 | 319 |
| 9 | TAB_QWERTYUIOPAS | USR | HISTORY | 12-APR-23 07.34.27.186380 PM +08:00 | 08-APR-2023 19:30:39 | 57603137 | 57603137 | 100.0 | 2675898 | 319 |
| 10 | TAB_QWERTYUIOPAS | USR | HISTORY | 08-APR-23 07.30.39.822771 PM +08:00 | 05-APR-2023 19:30:15 | 57514381 | 57514381 | 100.0 | 2667714 | 319 |
| 11 | TAB_QWERTYUIOPAS | USR | HISTORY | 05-APR-23 07.30.15.853808 PM +08:00 | 01-APR-2023 19:30:33 | 56911270 | 56911270 | 100.0 | 2643162 | 319 |
Indexes Statistics Versions: TAB_QWERTYUIOPAS (USR)
| # | Index Name | Owner | Version Type | Save Time | Last Analyzed | Num Rows |
Sample Size |
Perc | Distinct Keys |
Blevel | Leaf Blocks |
Avg Leaf Blocks per Key |
Avg Data Blocks per Key |
Clustering Factor |
|---|---|---|---|---|---|---|---|---|---|---|---|---|---|---|
| 67 | INX_EXTXXX3 | USR | CURRENT | 2023-05-06/10:39:23 | 60172285 | 268149 | 0.4 | 993 | 3 | 262098 | 263 | 17318 | 17197018 | |
| 68 | INX_EXTXXX3 | USR | HISTORY | 06-MAY-23 10.39.23.293618 AM +08:00 | 2023-05-03/19:33:30 | 59006085 | 262952 | 0.4 | 992 | 3 | 260302 | 262 | 17363 | 17224844 |
| 69 | INX_EXTXXX3 | USR | HISTORY | 03-MAY-23 07.33.30.522839 PM +08:00 | 2023-04-29/19:34:04 | 55447571 | 247094 | 0.4 | 992 | 3 | 242126 | 244 | 16703 | 16570273 |
| 70 | INX_EXTXXX3 | USR | HISTORY | 29-APR-23 07.34.04.044406 PM +08:00 | 2023-04-26/19:38:18 | 55158097 | 245804 | 0.4 | 991 | 3 | 238311 | 240 | 16403 | 16256115 |
| 71 | INX_EXTXXX3 | USR | HISTORY | 26-APR-23 07.38.18.026010 PM +08:00 | 2023-04-22/19:34:25 | 57960612 | 258293 | 0.4 | 990 | 3 | 252449 | 254 | 17232 | 17060135 |
| 72 | INX_EXTXXX3 | USR | HISTORY | 22-APR-23 07.34.25.739328 PM +08:00 | 2023-04-19/19:36:18 | 55882680 | 249033 | 0.4 | 988 | 3 | 240780 | 243 | 16678 | 16478718 |
| 73 | INX_EXTXXX3 | USR | HISTORY | 19-APR-23 07.36.18.682023 PM +08:00 | 2023-04-15/19:31:44 | 59953721 | 267175 | 0.4 | 987 | 3 | 262098 | 265 | 18054 | 17819949 |
| 74 | INX_EXTXXX3 | USR | HISTORY | 15-APR-23 07.31.44.415922 PM +08:00 | 2023-04-12/19:34:53 | 55789779 | 248619 | 0.4 | 986 | 3 | 242351 | 245 | 16658 | 16424862 |
| 75 | INX_EXTXXX3 | USR | HISTORY | 12-APR-23 07.34.53.972449 PM +08:00 | 2023-04-08/19:31:05 | 54001097 | 240648 | 0.4 | 986 | 3 | 238087 | 241 | 16261 | 16033736 |
| 76 | INX_EXTXXX3 | USR | HISTORY | 08-APR-23 07.31.05.861133 PM +08:00 | 2023-04-05/19:30:43 | 56885518 | 253502 | 0.4 | 986 | 3 | 243473 | 246 | 17136 | 16896324 |
| 77 | INX_EXTXXX3 | USR | HISTORY | 05-APR-23 07.30.43.739025 PM +08:00 | 2023-04-01/19:30:58 | 56322726 | 250994 | 0.4 | 985 | 3 | 243697 | 247 | 16768 | 16516641
|
NOTE:
注意表和索引该时间段都没有自动收集。 因为上面有绑定变量窥探到的变量值,那我们把全表扫时的变量带进去,确认真的是收集统计信息修正了吗?
10053 TRACE
当我们带入001358变量值后,还可以复现全表扫描,那到这里可能有人想到了问题点。下面直接附上10053 trace file部分内容。
SQL> connect / as sysdba
SQL> oradebug setmypid
SQL> oradebug unlimit
SQL> oradebug event 10053 trace name context forever, level 1

SQL> explain plan for  ...enter your query here...

SQL> oradebug event 10053 trace name context off
SQL> oradebug tracefile_name

-- trace file
*******************************************
Peeked values of the binds in SQL statement
*******************************************

Final query after transformations:******* UNPARSED QUERY IS *******
SELECT COUNT(*) "TOTAL_COUNT" FROM "USR"."TAB_QWERTYUIOPAS" "O" WHERE "O"."QUERYXXX">='2023/03/01 00:00:00'
AND "O"."QUERYXXX"<='2023/03/31 00:00:00' AND "O"."EXXXX3"='001358' AND '2023/03/31 00:00:00'>='2023/03/01 00:00:00'
kkoqbc: optimizing query block SEL$F5BB74E1 (#0)

***************************************
BASE STATISTICAL INFORMATION
***********************
Table Stats::
  Table: TAB_QWERTYUIOPAS  Alias:  O  (Using composite stats)
    #Rows: 58992346  #Blks:  2734209  AvgRowLen:  319.00  ChainCnt:  0.00
Index Stats::
 ...
  Index: INX_EXTXXX3  Col#: 40
    LVLS: 3  #LB: 251775  #DK: 994  LB/K: 253.00  DB/K: 17075.00  CLUF: 16973517.00
  Index: INX_QUERYXIXX  Col#: 18
    LVLS: 3  #LB: 483492  #DK: 31264768  LB/K: 1.00  DB/K: 1.00  CLUF: 47778440.00
...
  Index: PK_IQUERYHISTORY  Col#: 1
    LVLS: 3  #LB: 407799  #DK: 56939871  LB/K: 1.00  DB/K: 1.00  CLUF: 51116553.00
Access path analysis for TAB_QWERTYUIOPAS
***************************************
SINGLE TABLE ACCESS PATH
  Single Table Cardinality Estimation for TAB_QWERTYUIOPAS[O]
  Column (#40):
    NewDensity:0.000057, OldDensity:0.002967 BktCnt:254, PopBktCnt:240, PopValCnt:24, NDV:994
  Column (#40): EXXXX3(
    AvgLen: 7 NDV: 994 Nulls: 585162 Density: 0.000057
    Histogram: HtBal  #Bkts: 254  UncompBkts: 254  EndPtVals: 38

  Column (#18):
    NewDensity:0.000000, OldDensity:0.000000 BktCnt:254, PopBktCnt:0, PopValCnt:0, NDV:31264768
  Column (#18): QUERYXXXX(
    AvgLen: 20 NDV: 31264768 Nulls: 0 Density: 0.000000
    Histogram: HtBal  #Bkts: 254  UncompBkts: 254  EndPtVals: 255
  Table: TAB_QWERTXXXXAS  Alias: O
    Card: Original: 58992346.000000  Rounded: 79668  Computed: 79667.56  Non Adjusted: 79667.56
  Access Path: TableScan
    Cost:  743146.94  Resp: 743146.94  Degree: 0
      Cost_io: 740517.00  Cost_cpu: 77421299057
      Resp_io: 740517.00  Resp_cpu: 77421299057
  Access Path: index (AllEqRange)
    Index: INX_EXTXXX3
    resc_io: 748296.00  resc_cpu: 8323150688
    ix_sel: 0.043441  ix_sel_with_filters: 0.043441
    Cost: 748578.73  Resp: 748578.73  Degree: 1
  Access Path: index (RangeScan)
    Index: INX_QUERYXIXX
    resc_io: 1626415.00  resc_cpu: 13774888680
    ix_sel: 0.033700  ix_sel_with_filters: 0.033700
    Cost: 1626882.92  Resp: 1626882.92  Degree: 1

******** Cost index join ********
Index join: Joining index INX_EXTXXX3
Index join: Joining index INX_QUERYXIXX
Ix HA Join
  Outer table:  TAB_QWERTYUIOPAS  Alias: O
    resc: 252234.49  card 58992346.00  bytes: 17  deg: 1  resp: 252234.49
  Inner table:    Alias:
    resc: 483986.54  card: 58992346.00  bytes: 30  deg: 1  resp: 483986.54
    using dmeth: 2  #groups: 1
    Cost per ptn: 198690.65  #ptns: 1
    hash_area: 256 (max=262144) buildfrag: 208836  probefrag: 302451  ppasses: 1
  Hash join: Resc: 934911.67  Resp: 934911.67  [multiMatchCost=0.00]
******** Index join cost ********
Cost: 934911.67
******** End index join costing ********
  Best:: AccessPath: TableScan
         Cost: 743146.94  Degree: 1  Resp: 743146.94  Card: 79667.56  Bytes: 0

***************************************
Note:
注意表有近6000万记录,谓词条件列EXXXX3有994 distinct值,可见重复很高,列上有等高直方图,从UncompBkts: 254 EndPtVals: 38 判断压缩后相差这么大判断,在254个桶中有些桶endpoint_value重复值较多,存在严重的倾斜情况。CBO计算全表扫的COST小于使用该索引,因为10053缺失这类信息,从DBA_HISTOGRAMS可以查看列的柱状图分布。
柱状图分布Height Balanced Histogram
查询视图DBA_HISTOGRAMS可以得到列的柱状图,在数据库不同的版本中视图列数可能不同。主要关注这几列
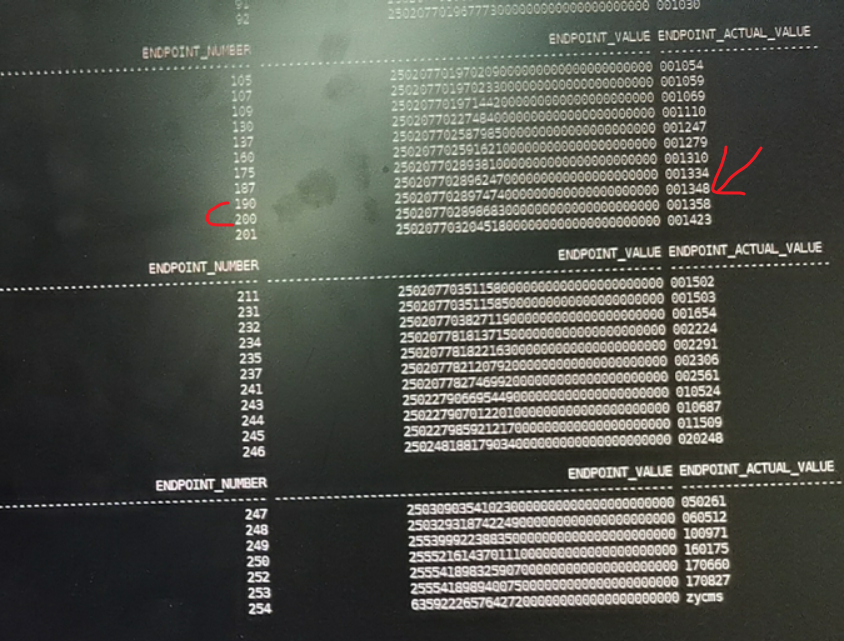
Note:
可见传入的变量值’001358‘刚好是柱状图的endpoint value, 但对应前面有10个桶,属于popular value, 高频值,这就导致CBO产生了比较高的COST值。
为什么执行计划变了?
前面我们有提到这个环境库启用了peek bind并禁用ACS自适应游标共享,可能是因为某些原因因为该SQL执行频率并不高,SQL被age out出shared pool, 在SQL再次执行重新reload回Shared pool里需要peek变量值,然后根据变量第一次的值生成执行计划,后面再执行相同SQL时,发现shared pool中存在相同文本直接使用第一次的执行计划,因为当前的ACS已禁用,当然如果ACS开着又可能会引入一些parse相关的问题如latch, version high.., 所以使用变量的SQL第一次传入的值就很关键,有一定小运气在里面,如果第一次传入的是低频值,那就用索引。 这个现象在大师Jonathan Lewis书中记录柱状图章节同样有提到。
Jonathan Lewis ‘s 《Cost-Based Oracle Fundamentals 》
Bind Variable Peeking
Of course, things got messier when 9i introduced bind variable peeking. Whenever a statement is
optimized, Oracle will (in almost all cases) check the actual values of any bind variables and
optimize the statement for those specific values.PARSING AND OPTIMIZING
When an SQL statement is first executed, it has to be checked for syntax, interpreted, and optimized. Thereafter
if the same piece of text is fired at the database again, it may be recognized as previously used, in which
case the existing execution plan may be tracked down and reused.
However, even when a statement is still in memory, some of the information about the execution plan
may become invalid, or may get pushed out of memory by the standard memory management LRU routines.
When this happens, the statement will have to be reoptimized. (You can detect this from the loads and
invalidations columns in v$sql, summarized in the reloads and invalidations columns of
v$librarycache. Reloads occur when information is lost from memory; invalidations occur when some of
the dependent information changes.)
The reuse (or sharing) of SQL is generally a good thing—but if the execution plan generated on the first
use of a statement caters to an unlucky set of values, then every subsequent execution of that statement will
follow the same unlucky execution plan until you can force the statement out of memory—perhaps by the
extreme method of flushing the shared pool.
Bind variable peeking has the unfortunate side effect of making it very easy for one user to introduce an
execution plan that is bad news for every other user for an arbitrary amount of time, until that execution plan
happens to get flushed from the shared pool for some reason.
我们看一下SQL是否有AGE OUT出Shared pool。
SQL First Load
Performance metrics of child cursors of 4ruhsafdgfj0x while still in memory.
| # | Inst ID |
Child Num |
Plan HV | Execs | Fetch | Loads | Inval | Parse Calls |
Buffer Gets |
Optimizer Mode |
Cost | Opt Env HV | Parsing Schema Name |
Module | First Load | Last Load | Last Active |
|---|---|---|---|---|---|---|---|---|---|---|---|---|---|---|---|---|---|
| 2 | 1 | 0 | 1429561684 | 26 | 26 | 2 | 1 | 26 | 9138 | ALL_ROWS | 1058 | 642354766 | USR | JDBC Thin Client | 2023-05-06/10:38:42 | 2023-05-06/10:40:12 | 2023-05-06/10:40:12 |
| 1 | 2 | 0 | 1429561684 | 124 | 124 | 12 | 3 | 124 | 105242 | ALL_ROWS | 1058 | 642354766 | USR | JDBC Thin Client | 2023-05-06/01:02:24 | 2023-05-06/10:39:55 | 2023-05-06/10:40:11 |
| Plan HV | Avg Elapsed Time (secs) |
Avg CPU Time (secs) |
Avg IO Time (secs) |
Total Execs |
Min Cost |
Max Cost |
First Snapshot | Last Snapshot |
|---|---|---|---|---|---|---|---|---|
| 1 | 1429561684 | 2.129 | 0.302 | 1 | 10741 | 1123 | 2023-04-10/01:00:16 | 2023-05-06/01:30:12 |
| 2 | 1634677993 | 774.059 | 67.064 | 1 | 44 | 740643 | 2023-05-06/01:30:12 | 2023-05-06/10:30:15 |
AWR
SGA breakdown differencez
- ordered by Pool, Name
- N/A value for Begin MB or End MB indicates the size of that Pool/Name was insignificant, or zero in that snapshot
| Pool | Name | Begin MB | End MB | % Diff |
|---|---|---|---|---|
| java | free memory | 896.00 | 896.00 | 0.00 |
| large | CTWR dba buffer | 4.79 | 4.79 | 0.00 |
| large | PX msg pool | 15.63 | 15.63 | 0.00 |
| large | free memory | 99.29 | 99.29 | 0.00 |
| large | krcc extent chunk | 7.92 | 7.92 | 0.00 |
| shared | FileOpenBlock | 102.40 | 102.40 | 0.00 |
| shared | KGLH0 | 1,316.13 | 1,308.75 | -0.56 |
| shared | KGLHD | 200.19 | 198.73 | -0.73 |
| shared | SQLA | 1,494.70 | 1,505.73 | 0.74 |
| shared | db_block_hash_buckets | 356.00 | 356.00 | 0.00 |
| shared | free memory | 1,660.42 | 1,662.17 | 0.11 |
| shared | gcs resources | 1,090.61 | 1,090.61 | 0.00 |
| shared | gcs shadows | 755.04 | 755.04 | 0.00 |
| shared | kglsim object batch | 127.54 | 127.54 | 0.00 |
| streams | free memory | 895.94 | 895.94 | 0.00 |
| buffer_cache | 37,888.00 | 37,888.00 | 0.00 | |
| fixed_sga | 2.16 | 2.16 | 0.00 | |
| log_buffer | 39.54 | 39.54 | 0.00 |
Library Cache Activity
- “Pct Misses” should be very low
| Namespace | Get Requests | Pct Miss | Pin Requests | Pct Miss | Reloads | Invali- dations |
|---|---|---|---|---|---|---|
| ACCOUNT_STATUS | 1,392 | 0.00 | 0 | 0 | 0 | |
| BODY | 1,290 | 0.00 | 1,744 | 0.00 | 0 | 0 |
| CLUSTER | 20 | 5.00 | 20 | 5.00 | 0 | 0 |
| DBLINK | 1,437 | 0.00 | 0 | 0 | 0 | |
| EDITION | 488 | 0.00 | 946 | 0.00 | 0 | 0 |
| INDEX | 1,113 | 0.00 | 1,113 | 0.00 | 0 | 0 |
| QUEUE | 9 | 0.00 | 399 | 0.00 | 0 | 0 |
| SCHEMA | 539 | 0.00 | 0 | 0 | 0 | |
| SQL AREA | 23,179 | 50.64 | 166,761 | 21.17 | 53 | 0 |
| SQL AREA BUILD | 11,809 | 99.70 | 0 | 0 | 0 | |
| SQL AREA STATS | 11,804 | 99.69 | 11,804 | 99.69 | 0 | 0 |
| TABLE/PROCEDURE | 26,143 | 0.20 | 83,245 | 0.27 | 56 | 0 |
Note:
基本上可以判断当时有新的SQL执行,把执行频率少的SQL age out出内存,而刚好第一次传入的变量是一个高频值,选择了全表扫,后续所有的SQL继续沿用这个执行计划,直到人工执行了统计信息收集,使shared pool的该SQL 失效,再次解析时传入的值为低频的变量值,执行计划改为索引扫描。