环境oracle 11.2.0.4 2-nodes RAC, 有一套ASM instance登录实例时总是提示ORA-20 进程数耗尽, 该错误常见于DB instance ,本次多台数据库同时出现该问题,但数据库实例暂时未挂,后发现所有机器有部署ntpdata crontab同步OS时间,最后一次错误向前调整了2年的时间后,又修改后出现的该问题,简单记录。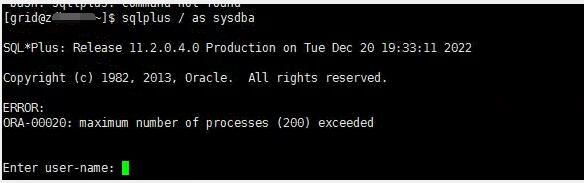
ASM 进程数据最佳实践
For 11.2 set up, the formula is PROCESSES = 50 + 50*n
where n is the number database instances connecting to the Oracle ASM instance.
For 12c set up, the formulas are
For n < 10, PROCESSES = 50*n + 50 For n >= 10, PROCESSES = 10*n + 450
但是从OS层ps 分析进程数据在2位数,ASM processes当前200. 分析asm alert log
Sat Jun 11 08:17:22 2022
NOTE: client kmes2:jcbkdg registered, osid 80375, mbr 0x1
Sat Jun 11 08:18:06 2022
NOTE: client kmys2:kmys registered, osid 81633, mbr 0x2
Sun Jun 19 00:30:06 2022
Warning: VKTM detected a time drift.
Time drifts can result in an unexpected behavior such as time-outs. Please check trace file for more details.
Sun Dec 19 10:00:07 2010
Warning: VKTM detected a time drift.
Time drifts can result in an unexpected behavior such as time-outs. Please check trace file for more details.
Mon Dec 19 10:12:17 2022
Dumping diagnostic data in directory=[cdmp_20221219101217], requested by (instance=1, osid=83780 (CKPT)), summary=[incident=57763].
Mon Dec 19 10:14:17 2022
Errors in file /u01/app/grid/diag/asm/+asm/+ASM2/trace/+ASM2_ora_393188.trc (incident=35425):
ORA-00445: background process "PZ99" did not start after 120 seconds
Incident details in: /u01/app/grid/diag/asm/+asm/+ASM2/incident/incdir_35425/+ASM2_ora_393188_i35425.trc
Mon Dec 19 10:14:18 2022
Dumping diagnostic data in directory=[cdmp_20221219101418], requested by (instance=1, osid=392453), summary=[incident=57891].
Dumping diagnostic data in directory=[cdmp_20221219101418], requested by (instance=2, osid=393188), summary=[incident=35425].
Mon Dec 19 10:16:18 2022
Errors in file /u01/app/grid/diag/asm/+asm/+ASM2/trace/+ASM2_ckpt_74442.trc (incident=35329):
ORA-00445: background process "PZ98" did not start after 120 seconds

Mon Dec 19 10:28:20 2022
Errors in file /u01/app/grid/diag/asm/+asm/+ASM2/trace/+ASM2_ckpt_74442.trc (incident=35331):
ORA-00445: background process "PZ99" did not start after 120 seconds
Mon Dec 19 10:32:21 2022
Errors in file /u01/app/grid/diag/asm/+asm/+ASM2/trace/+ASM2_ora_430143.trc (incident=35428):
ORA-00445: background process "PZ95" did not start after 120 seconds
Mon Dec 19 10:34:21 2022
Errors in file /u01/app/grid/diag/asm/+asm/+ASM2/trace/+ASM2_ckpt_74442.trc (incident=35332):
ORA-00445: background process "PZ99" did not start after 120 seconds
Mon Dec 19 10:38:21 2022
Errors in file /u01/app/grid/diag/asm/+asm/+ASM2/trace/+ASM2_ora_443636.trc (incident=35429):
ORA-00445: background process "PZ94" did not start after 120 seconds
Mon Dec 19 10:40:21 2022


*** 2022-12-20 15:03:30.038
ORA-00020: maximum number of processes (200) exceeded
Trace file /u01/app/grid/diag/asm/+asm/+ASM1/trace/+ASM1_ora_376914.trc
Oracle Database 11g Enterprise Edition Release 11.2.0.4.0 - 64bit Production
With the Real Application Clusters and Automatic Storage Management options
ORACLE_HOME = /u01/app/11.2.0.4
System name:	Linux
Node name:	zdb001
Release:	3.10.0-957.21.3.el7.x86_64
Version:	#1 SMP Fri Jun 14 02:54:29 EDT 2019
Machine:	x86_64
Instance name: +ASM1
Redo thread mounted by this instance: 0
Oracle process number: 0
Unix process pid: 376914, image: oracle@aaa
Note:
注意日志中有记录实例运行期间,OS时间有变更到2010年,后来又改回2022年,但是时间变更后进程启动失败消息,猜测PZ倒序开始的是内部递归的并发进程,猜测是时间变更后导致的实例异常, 进程latch申请或释放异常,进程计数器错误.
查看数据库中进程数据
sqlplus -prelim / as sysdba
oradebug set unlimit
oradebug dump systemstate 258


*** 2022-12-20 16:03:15.699
Processing Oradebug command 'dump systemstate 258'
===================================================
SYSTEM STATE (level=2, with short stacks)
------------
System global information:
     processes: base 0x15923c578, size 200, cleanup 0x15f217fc0
     allocation: free sessions 0x15a25a7d0, free calls (nil)
     control alloc errors: 0 (process), 0 (session), 0 (call)
     PMON latch cleanup depth: 0
     seconds since PMON's last scan for dead processes: 108189
     system statistics:
0 OS CPU Qt wait time
70311619 Requests to/from client
3954786 logons cumulative
29 logons current
14230508 opened cursors cumulative
6 opened cursors current
0 user commits
660329 user rollbacks
96719875 user calls
18264699 recursive calls
2907489 recursive cpu usage
0 pinned cursors current
2845494 user logons cumulative
2845487 user logouts cumulative
0 session logical reads
0 session logical reads in local numa group
0 session logical reads in remote numa group
0 session stored procedure space
6742906 CPU used when call started
8537361 CPU used by this session
4998279697 DB time
0 cluster wait time
19670441982 concurrency wait time
94 application wait time
2762419658 user I/O wait time
Note:
DUMP中显示当进程登录并不多和OS ps显示的匹配。
解决方法:
重启ASM instance后恢复正常, 但建议避免使用ntpdate同步时间,而使用ntp服务微调时间,并应该防止时间向后倒退。