CF enqueues are control file enqueues, which occur during parallel access to the control file,it is a system enqueues generally only held for a very short time. the CF locks are used to serialize controlfile transactions and read and writes on shared portions of the controlfile.Control file enqueue is an expensive operation. For operations like updating checkpoint SCNs for datafiles, for no-logging operations, such enqueue on controlfile is taken.
P1: name|mode e.g. 43460005 , 4346 ASCII is CF , mode 5 is SSX
P2: correspond to 0.
In which modes can I hold or request an enqueue?
- 0: Enqueue is not held or requested
- 1: null (NULL)
- 2: row-S (SS)
- 3: row-X (SX)
- 4: share (S)
- 5: S/Row-X (SSX)
- 6: exclusive (X)
The CF enqueue can be seen during any action that requires reading the control file, Typically CF locks are allocated for a very brief time and used when:
.checkpointing
.switching logfiles
.archiving redologs
.performing crash recovery
.logfile manipulation
.begin/end hot backup
.DML access for NOLOGGING objects
Diag Method
1, Hanganalye
2, Systemstate dump
Search for ” ‘enq: CF – contention’ ” in the systemstate dump to identify the hold process, which call/top? what’s enqueue? hold mode?
1. Search for ” ‘enq: CF – contention’ ” in the systemstate dump, e.g.:
PROCESS 5:

 ----------------------------------------

 SO: 70000064b55a4d8, type: 2, owner: 0, flag: INIT/-/-/0x00

 OSD pid info: Unix process pid: 27127876, image: oracle@xxx (LGWR)

 ...

waiting for 'enq: CF - contention' blocking sess=0x70000064f750138 seq=50830 wait_time=0 seconds since wait started=0
 name|mode=43460005, 0=0, operation=0
 ...
 (enqueue) CF-00000000-00000000    DID: 0001-0005-00000007
 lv: 00 aa e7 5c 00 00 00 00 00 00 00 00 00 00 00 00  res_flag: 0x2
 res: 0x70000064f8be818, req: SSX, lock_flag: 0x0
 ...
Here, the LGWR process is waiting for CF enqueue in SSX mode.
2. <<name|mode=43460005, 0=0, operation=0>> – this indicates the enqueue type and its ID1 and ID2 value.
Here the enqueue type is CF (ASCII for 4346) and the ID1 , ID2 correspond to 0.
With this, the enqueue resource can be formed as CF-00000000-00000000. This is the CF resource being waited for and held by.
3. Now, the enqueue blocker has to be searched for using the same resource ‘CF-00000000-00000000’ having ‘mode=S’ in its process state.
The reason is, the LGWR is requesting the CF resource in SSX mode and so the holder of the resource should be incompatible like S mode and thus the LGWR has been waiting. i.e, the requestor cannot get the enqueue resource until the holder finishes its job and releases the enqueue. This is called incompatible mode.
PROCESS 1686:
 ...
 client info: rman channel=FX_ORA_SBT_TAPE3
 application name: rman@xxx (TNS V1-V3), hash value=0    <== RMAN process holds the CF enqueue
 action name: 0002732 STARTED65, hash value=1040409729
 waiting for 'control file sequential read' blocking sess=0x0 seq=23783 wait_time=0 seconds since wait started=0
 file#=0, block#=8aa, blocks=1
 ...
 SO: 7000006498a3988, type: 5, owner: 7000005fe0ed380, flag: INIT/-/-/0x00
 (enqueue) CF-00000000-00000000    DID: 0001-0696-00000109
 lv: 00 aa e7 5c 00 00 00 00 00 00 00 00 00 00 00 00  res_flag: 0x2
 res: 0x70000064f8be818, mode: S, lock_flag: 0x0   <== CF enqueue is held up in Shared mode
 own: 0x70000064f750138, sess: 0x70000064f750138, proc: 0x70000064a5ec7f0, prv: 0x70000064f8be828
 ...
Here, the CF enqueue has been blocked by the RMAN process in Shared mode. The process is not releasing the enqueue resource as it has been reading the control file for long time. This is evident with the wait event for the blocker process “control file sequential read”. The RMAN process reads the control file sequentially for its operation for long time and thus the CF enqueue resource has been held up in Shared mode and not yet released.
Thus, the blocker process of the CF enqueue contention has been identified using the systemstate dump. Once the CF enqueue blocker process is identified, further actions towards resolving the enqueue contention has to be followed. There are many cases causing the CF enqueue contention and this is one of the real time examples having the CF enqueue blocked by a RMAN process.
— CASE 1, IO issue
Current Wait Stack:
0: waiting for 'control file parallel write'
files=0x3, block#=0x4f, requests=0x3
wait_id=97366 seq_num=31832 snap_id=1
wait times: snap=20 min 13 sec, exc=20 min 13 sec, total=20 min 13 sec <<<<<<<<<<<<<<<< very high wait probably Disk IO issue
wait times: max=infinite, heur=20 min 13 sec
wait counts: calls=0 os=0
in_wait=1 iflags=0x5a0
— CASE 2 , controlfile huge
Current Wait Stack:
0: waiting for 'control file sequential read'
file#=0x0, block#=0x3163, blocks=0x1
wait_id=845082 seq_num=58663 snap_id=1
wait times: snap=0.000072 sec, exc=0.000072 sec, total=0.000072 sec <<<<<<<<<<<<<<<< IO no slow(time not long), but many times
wait times: max=infinite, heur=0.000072 sec
wait counts: calls=0 os=0
in_wait=1 iflags=0x5a0
There are 223 sessions blocked by this session.
Dumping one waiter:
inst: 2, sid: 1369, ser: 1
wait event: 'enq: CF - contention'
p1: 'name|mode'=0x43460005
p2: '0'=0x0
p3: 'operation'=0x0
row_wait_obj#: 4294967295, block#: 0, row#: 0, file# 0
min_blocked_time: 473 secs, waiter_cache_ver: 13578
Wait State:
fixed_waits=0 flags=0x22 boundary=0x0/-1
Session Wait History:
elapsed time of 0.000024 sec since current wait
0: waited for 'control file sequential read'
file#=0x0, block#=0x20a8, blocks=0x1
wait_id=845081 seq_num=58662 snap_id=1
wait times: snap=0.000331 sec, exc=0.000331 sec, total=0.000331 sec
wait times: max=infinite
wait counts: calls=0 os=0
occurred after 0.000024 sec of elapsed time
1: waited for 'control file sequential read'
file#=0x0, block#=0x1fc2, blocks=0x1
wait_id=845080 seq_num=58661 snap_id=1
wait times: snap=0.000386 sec, exc=0.000386 sec, total=0.000386 sec
wait times: max=infinite
wait counts: calls=0 os=0
occurred after 0.000023 sec of elapsed time
3, create a table for v$active_session_hisotry
SQL> create table gvash tablespace users as select * from gv$active_session_history;
4, find the waitchain(Tanelpoder’s scripts tools)
SQL> @ash/ash_wait_chains program2||event2 1=1 sysdate-1/24/12 sysdate
5, find the holder
select l.sid, p.program, p.pid, p.spid, s.username, s.terminal, s.module, s.action, s.event, s.wait_time, s.seconds_in_wait, s.state
from v$lock l, v$session s, v$process p
where l.sid = s.sid
and s.paddr = p.addr
and l.type='CF'
and l.lmode >= 5;
1. If you see the holder is: background process, typically LGWR, CKPT or ARCn
the holder is holding the enqueue for a longer period of time
Check if the redologs are sized adequately. Typically you want to drive at a log switch every 30 minutes. Also verify checkpointing parameters such as fast_start_mttr_target.
2. If you see the holder is: a user session (so no background process)
the holder is constantly changing the wait event of the holder is ‘control file parallel write’
Then it is most likely that the contention for the CF enqueue is caused by DML on a NOLOGGING object.
sulution to enable LOGGING or Set event 10359 to level 1 to skip updating the unrecoverable SCN’s in the control file.
NOTE! Be aware of bug 12360160 which affects 11.2.0.2 that setting 10359 has no effect if DB_UNRECOVERABLE_SCN_TRACKING is set to false at startup
3. Check if the archive destination (log_archive_dest_n) are accessible, you may need to involve System/Storage admins.
If you are using NFS filesystem for the archive destinations then make sure there is no issue with nfs as this can lead to log switch hanging and that leads to CF enqueue as the lock holder will be either LGWR or ARCn processes
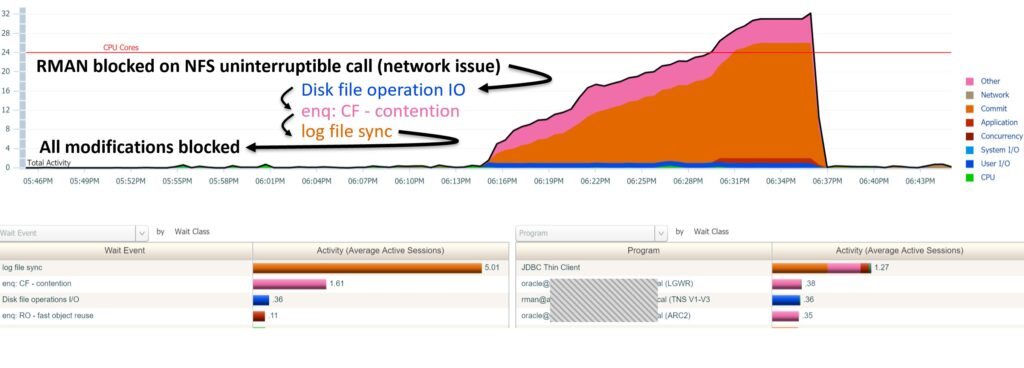
The RMAN snapshot control file is stored in an NFS file system,The access to NFS file system is extremely slow which provokes that control file will be locked for so much time and causes the instance failure due to not being able to get control file enqueue. When RMAN is started,the db instance maybe hang.
— a case
4. If you see the holder is: MMON, M000
the holder is ‘control file parallel write’ , when flashback database enable, sometimes due to a lot of flashback logs in FRA, the MMON try to monitor FRA usage while hold the CF lock a long time. alse query v$flash_recovery_area_usage or v$recovery_file_dest take a amount time to complete. solution to clean flasback log.
Rman feature usage tracking causes CF enqueue contention. M000 process holds CF for a long time. It is likely to show kewfeus_execute_usage_sampling on the stack with krbc_rman_usage also present .check bug 16485447
5, If you see the holder is : RMAN
The RMAN process reads the control file sequentially for its operation for long time and thus the CF enqueue resource has been held up in Shared mode and not yet released. You can kill the rman process. There are many cases causing the CF enqueue contention and this is one of the real time examples having the CF enqueue blocked by a RMAN process.IO could be slow as the RMAN process has to wait for long time to read the control file.
6, The Control file itself can be large enough containing huge no.of records history and this would lead to the processes accessing the control file take long time to finish.
The view V$CONTROLFILE_RECORD_SECTION can be queried and check for the CF record section having huge RECORD_SIZE and try to reduce the size it has occupied.Check for CONTROL_FILE_RECORD_KEEP_TIME parameter and make sure it has not been set to large value. By default, its 7.
In such cases of control file becoming huge, controlfile needs to be recreated as part of the fix.
7, When the CF enqueue has been heldup for more than 900 seconds and not released, the following error appears in the Database alert_log.
ORA-00494: enqueue [CF] held for too long (more than 900 seconds.This may be accompanied by the instance crash due to CF enqueue contention for long time.
_controlfile_enqueue_timeout: This parameter is used to set the timeout limit for CF enqueue. By default, it is 900 seconds.
_kill_controlfile_enqueue_blocker:This parameter enables killing controlfile enqueue blocker on timeout.TRUE. Default value. if the holder is a background process, for example the LGWR, the kill of the holder leads to instance crash. set FALSE to Disable this mechanism.
_kill_enqueue_blocker=1 default is 2, set value =1 , if the enqueue holder is a background process, then it will not be killed, therefore the instance will not crash. If the enqueue holder is not a background process, the new 10.2.0.4 mechanism will still try to kill it.
8, From LGWR tracefile messages, you can interpret that your I/O subsystem might not be performing as expected. For every lgwr write to disk which takes more than 500ms, a warning is written to the lgwr tracefile.
Known ISSUE:
Bug 33896418 – RMAN: ‘enq: cf – contention’ waits when running rman delete obsolete (Doc ID 33896418.8) affected BELOW 23.1 19.21
Bug 33004888 – LMHB terminates the instance while CKPT waiting on “enq: CF – contention” which holded by RMAN process (Doc ID 33004888.8) affected BELOW 23.1 19.15
Bug 34545238 – RMAN: LGWR waits for event ‘enq: cf – contention’ while RMAN maintenance command (delete / crosscheck) in progress (Doc ID 34545238.8) Versions >= 19.11 but BELOW 23.1
Bug 35663882 – [RMAN] Many Sessions are Blocked by CF Enqueue Contention (Doc ID 35663882.8) Versions >= 19.0 but BELOW 23.4
Bug 12904429 – rman delete achivelog holds cf enqueue unnecessarily (Doc ID 12904429.8) Versions >= 11.2 but BELOW 12.1
Bug 16485447 – RMAN feature usage tracking can hold CF enqueue too long in M000 (Doc ID 16485447.8) 11.2.0.3
Bug 34053514 – ORA-19693: backup piece <piece> already included or ORA-29770 with RMAN Holding CF Enqueue (Doc ID 34053514.8) BELOW 23.1