Troubleshoot DDL递归SQL触发的row cache lock deadlock(死锁)
这是几天前遇到的一个案例,在这个案例又有太多的巧合, 虽然最后也未从SR那里明确BUG,并且因版本不在支持的服务期不能再深究,但是过程还是值得一看,环境是11.2.0.3.7 2-Nodes RAC on HPUX 11.31. 当时是大量的应用会话是”cursor: pin s wait on x”和”row cache lock” 等待, 而最终的堵塞者又正在执行一个DDL triiger 中的insert语句, 为了尽快恢复业务,我们KILL了堵塞者,业务恢复。
先看一下当前的堵塞chains大况,(这里使用的是TanelPoder的脚本包)。
SQL> @ash_wait_chains username||':'||event2 session_type='FOREGROUND' sysdate-2/24 sysdate-1/24

-- Display ASH Wait Chain Signatures script v0.2 BETA by Tanel Poder ( http://blog.tanelpoder.com )

%This     SECONDS        AAS WAIT_CHAIN
------ ---------- ---------- ------------------------------------------------------------------------------------------------------------------------------------------------------------------------------------------------------------------------------------------------------------------------------------------------------------
  55%      253828       70.5 -> ICDMAIN:cursor: pin S  -> ICDMAIN:library cache lock
  13%       61698       17.1 -> ICDMAIN:library cache lock  -> ICDMAIN:row cache lock  -> ICDMAIN:row cache lock
   3%       13468        3.7 -> NETRIXDB2:cursor: pin S wait on X  -> NETRIXDB:library cache lock  -> NETRIXDB:row cache lock  -> ICDMAIN:row cache lock
   3%       13468        3.7 -> NETRIXDB4:cursor: pin S wait on X  -> NETRIXDB:library cache lock  -> NETRIXDB:row cache lock  -> ICDMAIN:row cache lock
   3%       13468        3.7 -> NETRIXDB3:cursor: pin S wait on X  -> NETRIXDB:library cache lock  -> NETRIXDB:row cache lock  -> ICDMAIN:row cache lock
   2%       10602        2.9 -> ICDCCT:row cache lock  -> ICDMAIN:row cache lock
   2%       10101        2.8 -> NETRIXDB:cursor: pin S wait on X  -> NETRIXDB:library cache lock  -> NETRIXDB:row cache lock  -> ICDMAIN:row cache lock
   2%        7068          2 -> ICDCCT:library cache lock  -> ICDCCT:row cache lock  -> ICDMAIN:row cache lock
   2%        7068          2 -> ICDNGOC:row cache lock  -> ICDMAIN:row cache lock
   1%        5430        1.5 -> ICDPUB:ON CPU
   1%        3534          1 -> NETRIXDB2:library cache lock  -> NETRIXDB2:row cache lock  -> ICDMAIN:row cache lock
   1%        3534          1 -> NETRIXDB:cursor: pin S wait on X  -> NETRIXDB2:library cache lock  -> NETRIXDB2:row cache lock  -> ICDMAIN:row cache lock
   1%        3534          1 -> NETRIXDB3:cursor: pin S wait on X  -> NETRIXDB2:library cache lock  -> NETRIXDB2:row cache lock  -> ICDMAIN:row cache lock
   1%        3534          1 -> ICDCCT:library cache lock
   1%        3534          1 -> NETRIXDB4:cursor: pin S wait on X  -> NETRIXDB2:library cache lock  -> NETRIXDB2:row cache lock  -> ICDMAIN:row cache lock
   1%        3534          1 -> ICDMAIN:row cache lock
   1%        3534          1 -> NETRIXDB2:row cache lock  -> ICDMAIN:row cache lock
   1%        3534          1 -> NETRIXDB3:row cache lock  -> ICDMAIN:row cache lock
   1%        3534          1 -> ICDSR:library cache lock  -> ICDCCT:row cache lock  -> ICDMAIN:row cache lock
   1%        3533          1 -> ICDKBS:row cache lock  -> ICDMAIN:row cache lock
   1%        3398         .9 -> NETRIXDB4:row cache lock  -> ICDMAIN:row cache lock
   1%        3367         .9 -> NETRIXDB:row cache lock  -> ICDMAIN:row cache lock
   1%        3367         .9 -> NETRIXDB:library cache lock  -> NETRIXDB:row cache lock  -> ICDMAIN:row cache lock
   1%        2938         .8 -> ICDMAIN:row cache lock  -> ICDMAIN:row cache lock
   0%        1861         .5 -> PATROLDB:db file sequential read
   0%        1732         .5 -> ICDSR:row cache lock
   0%        1729         .5 -> ICDMAIN:cursor: pin S wait on X  -> ICDMAIN:library cache lock
   0%        1564         .4 -> PATROLDB:ON CPU
   0%        1521         .4 -> YYJK:ON CPU
   0%        1449         .4 -> ICDCCT:row cache lock

30 rows selected.
Note:
主要问题还是发生在SQL解析相关,最终堵塞是library cache lock 和row cache lock. 这是读的最近2小时的v$active_session_history, 也可以使用dash_wait_chains.sql 包, 当然自己可以灵活的从dba_hist_active_sess_history取10秒快照的活动session堵塞情况。
SELECT
    TO_CHAR(sample_time,'yyyymmdd hh24:mi') etime,
    event,
    program,
    session_state,
    blocking_inst_id,
    blocking_session_status,
    blocking_session,
    machine,
    session_id,
    session_serial#,
    user_id,
    sql_id,
    top_level_sql_id,
    sql_exec_start,
    p1text,
    p1
FROM
    dba_hist_active_sess_history
WHERE
    sample_time BETWEEN TO_DATE('20180718 20:00','yyyymmdd hh24:mi') AND TO_DATE('20180719 00:40','yyyymmdd hh24:mi')
Note:
dba_hist_active_sess_history确实对于历史性能问题的分配提供了大量的信息,不在本篇描述范围,建议顺藤摸瓜找到问题最早的时间点和阻塞链条的终端。
会话阻塞链条
–############ block chains 从上到下的堵塞关系 #############
| 会话 | 应用 | 等待事件 | 当前执行的SQLID 顶级SQLID |
| N+ | aplogic@HBKF-BQ-IVR4 (TNS V1-V3) | (cursor: pin S wait on X) | 67r5ngxtfqa4k cxs4xwrsst0ys |
| 2:10179 | aplogic@NQCTIIVR1 (TNS V1-V3) | (library cache lock) | 67r5ngxtfqa4k cxs4xwrsst0ys |
| 1:2278 | oracle@qdty1 (J002) | (row cache lock) | 5cwvjc63qnwnq 85xgnfc9wuf4m |
| 1:9074 | oracle@qdty1 (J000) | row cache lock | 5cwvjc63qnwnq 9w7203h1f4r43 |
| 2:6423 | oracle@qdty2 (J001) | row cache lock | 5cwvjc63qnwnq 9w7203h1f4r43 |
| 1:9074 |
SQL TEXT:
67r5ngxtfqa4k 是业务的insert vlaues
5cwvjc63qnwnq 是 INSERT INTO DDL_EVENTS SELECT :B1 , SYSDATE, ORA_LOGIN_USER, ORA_DICT_OBJ_NAME, ORA_DICT_OBJ_OWNER, ORA_DICT_OBJ_TYPE, ORA_SYSEVENT, MACHINE, PROGRAM, OSUSER FROM SYS.DUAL, SYS.V_$SESSION WHERE SYS_CONTEXT(‘USERENV’,’SESSIONID’ ) = AUDSID(+)
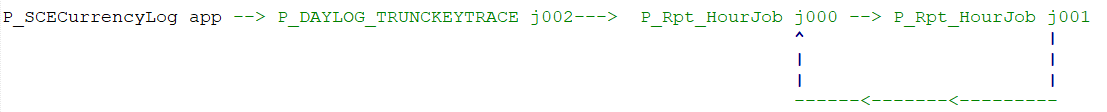
cxs4xwrsst0ys 是Procedure P_SCECurrencyLog
85xgnfc9wuf4m是procedure P_DAYLOG_TRUNCKEYTRACE
9w7203h1f4r43 是procedure P_Rpt_HourJob
SQL堵塞链条
Note:
现在分析当前的情况是大量的应用在执行一个存储中的insert时无法解析,被1节点job 002进程执行的procedure 堵塞, 而job 002又被节点1的9074会话 job 000进程堵塞, job 000进程又被节点2的6423会话job 001进程堵塞,而节点2的job 001又被节点1的job 000进程堵塞,现在是因为会话1:9074和2:6423互相堵塞死锁,并且都在等待row cache lock,而且当前broker会话的sql_id内容也不是top_level_sql_id的内容。后来分析了2个JOB, 发现是2个JOB分布在2个不同的用户下, 执行了不同的存储过程,存储过程中确实有Truncate Table,但是不同的表。 因为有DDL 操作所以才递归的执行了DDL Trigger中的SQL INSERT INTO DDL_EVENTS, 正是当前会话的SQL_ID.
当时CPU 资源空闲,当前的数据库确实是ASMM,但是问题时间段SGA没有自动调整,而且DDL trigger及相关的表最近都没有DDL 变动,并且该SQL最后一次解析是半年前,这个触发器已经上了1年的时间,虽然DDL trigger性能不如Audit 但是当前的数据库并未开启,同时领导有想知道是谁动了某些表时DDL trigger还是能提供依据。并且DDL TRIGGER中只是一条insert,虽然其中有sequence调用, 但sequence是先取nextval后insert, 并且根据row cache lock 的p1 是dc_objects, 而不是dc_sequences,基本上排除了sequence问题。现在需要找出在等待哪个row cache.
DB ALERT LOG
# node 1 db alert log
2018-07-19 04:23:31.138000 +08:00
Thread 1 advanced to log sequence 558160 (LGWR switch)
  Current log# 4 seq# 558160 mem# 0: /dev/ty_oravg02/rty_redo04
2018-07-19 04:23:36.273000 +08:00
Archived Log entry 757912 added for thread 1 sequence 558159 ID 0x8ab9ecdf dest 1:
2018-07-19 04:23:56.163000 +08:00
>>> WAITED TOO LONG FOR A ROW CACHE ENQUEUE LOCK! pid=1400
System State dumped to trace file /oracle/app/oracle/diag/rdbms/tyjc/tyjc1/trace/tyjc1_j000_19858.trc
2018-07-19 04:24:19.884000 +08:00
>>> WAITED TOO LONG FOR A ROW CACHE ENQUEUE LOCK! pid=850
2018-07-19 04:25:10.395000 +08:00
Thread 1 advanced to log sequence 558161 (LGWR switch)

2018-07-19 07:17:40.669000 +08:00
>>> WAITED TOO LONG FOR A ROW CACHE ENQUEUE LOCK! pid=1327
System State dumped to trace file /oracle/app/oracle/diag/rdbms/tyjc/tyjc1/trace/tyjc1_ora_16800.trc
# node 2 db alert log
Thu Jul 19 04:20:17 2018
Archived Log entry 757909 added for thread 2 sequence 199532 ID 0x8ab9ecdf dest 1:
Thu Jul 19 04:24:04 2018
>>> WAITED TOO LONG FOR A ROW CACHE ENQUEUE LOCK! pid=177
System State dumped to trace file /oracle/app/oracle/diag/rdbms/tyjc/tyjc2/trace/tyjc2_j001_18176.trc
Thu Jul 19 04:25:12 2018
Thread 2 advanced to log sequence 199534 (LGWR switch)
  Current log# 11 seq# 199534 mem# 0: /dev/ty_oravg02/rty_redo11
Thu Jul 19 04:25:14 2018
Archived Log entry 757913 added for thread 2 sequence 199533 ID 0x8ab9ecdf dest 1:
Thu Jul 19 04:30:12 2018
Thread 2 advanced to log sequence 199535 (LGWR switch)
  Current log# 10 seq# 199535 mem# 0: /dev/ty_oravg02/rty_redo10
Thu Jul 19 04:30:14 2018
Archived Log entry 757917 added for thread 2 sequence 199534 ID 0x8ab9ecdf dest 1:
Thu Jul 19 04:34:31 2018
Restarting dead background process DIA0   <<<<<<<<<
Thu Jul 19 04:34:31 2018
DIA0 started with pid=10, OS id=2512

Thu Jul 19 05:13:15 2018
Restarting dead background process DIA0
Thu Jul 19 05:13:15 2018
DIA0 started with pid=10, OS id=15632

Thu Jul 19 05:27:40 2018
Restarting dead background process DIA0
Thu Jul 19 05:27:40 2018
DIA0 started with pid=10, OS id=20443
Thu Jul 19 05:28:52 2018
Thread 2 advanced to log sequence 199547 (LGWR switch)
  Current log# 10 seq# 199547 mem# 0: /dev/ty_oravg02/rty_redo10
...
Thu Jul 19 05:33:49 2018
Archived Log entry 757969 added for thread 2 sequence 199547 ID 0x8ab9ecdf dest 1:
Thu Jul 19 05:35:26 2018
Restarting dead background process DIA0
Thu Jul 19 05:35:26 2018
DIA0 started with pid=10, OS id=23435
什么是row cache lock
The shared pool contains a cache of rows from the data dictionary that helps reduce physical I/O on the data dictionary tables. The rowcache lock is used primarily to serialize changes to the data dictionary and is waited on when a lock on a data dictionary cache is required. Waits on this event usually indicate some form of DDL occuring, or possibly recursive operations such as storage management and incrementing sequence numbers.
When DDLs execute, they must acquire locks on the row cache in order to access and change the Data Dictionary information. Once the locks are taken then they can be allowed to modify individual rows in the data dictionary.
The dictionary cache is known as row cache as it keeps the information at row level opposed to the buffer cache that keeps the information at block level. The locks, which protect the definition of the data dictionary objects, are called as row cache locks. Normally DDL statements require row cache locks and the session will wait for the row cache lock to lock the data dictionary information.
This wait is not a RAC specific wait. It is applicable in single instance also, but has a bigger impact in the RAC environment since the library cache and row cache are globally coordinated.
-
- The Row Cache:
–Stores data dictionary rows.
–Is part of the shared pool
–Reduces the physical I/O to the SYSTEM tablespace on disk
–Uses Row Cache Locks to support fine-grain locking of data dictionary rows
-
- Lock implementation:
–The cached row acts as the resource structure.
–Lock structures are allocated dynamically from the shared pool.
–Types QA…QZ.
-
- Row cache lock event:
-Wait duration is 3 seconds.
-The wait parameters are:
–P1: cache id (cache# in V$ROWCACHE)
–P2: mode that is held
–P3: mode that is requested
-The lock request is abandoned after 1000 timeouts.
row cache 是shared pool中的一块内存区域,以row的形式cache着数据库字典,有助于减少数据字典表如tab$, col$的物理访问,而row cache lock是为了序列化的修改数据字典,在需要锁定数据字典时的一种锁等待,这种等待通常是在DDL发生时或一些递归操作和Sequence 序列的增长。根据P1值可以关连v$rowcache和v$rowcache_parent 以cache#找查具体的cache, 本案例的p1值分别为8 和11,都是dc_objects 更多相关可以查看MOS note. 278316.1 和DSI 405.
分析这个问题需要的数据:
DB ALERT 、ASH 、DASH 、AWR 、 SystemState DUMP or Hanalyze , xx trace file…
从DASH找到了阻塞会话,通常系统自动生成的SSD(systemstate dump)可以分析row cache的对象。
分析SYSTEMSTATE DUMP
从DB ALERT LOG 可以看到系统有在问题时间段内,两个节点都在4占左右最早生成过一次systemstate dump trace. 下面以该trace分析。因为从DASH阻塞会话的sql_exec_start是覆盖这个时间段的,所以这个SSD是可以做为问题开始的依据。 以下trace 内容已经过截取。分析的顺序可以是找堵塞的session \prcesses\ call \row cache obj \sql等,没有固定的标准。
----------------------------------------

 SO: 0xc000000d1b14b988, type: 4, owner: 0xc000000d19dd8368, flag: INIT/-/-/0x00 if: 0x3 c: 0x3
     proc=0xc000000d19dd8368, name=session, file=ksu.h LINE:12624 ID:, pg=0
    (session) sid: 9074 ser: 33801 trans: 0xc000000ce37d6588, creator: 0xc000000d19dd8368
              flags: (0x210041) USR/- flags_idl: (0x1) BSY/-/-/-/-/-

			  <<<<<<<<<<<<     0x00000001   user session (as opposed to recursive session)
			  <<<<<<<<<<<<     0x00000040   whether user session logs on to ORACLE
			  <<<<<<<<<<<<<    0x00010000   SKIP unusable indexes maintenance
			  <<<<<<<<<<<<<    0x00200000   recource checking in job q process enabled

              flags2: (0x40009) -/-/INC
              DID: , short-term DID:
              txn branch: 0x0000000000000000
              oct: 2, prv: 0, sql: 0xc000000d369275a8, psql: 0xc000000d369275a8, user: 28/XXXX
    ksuxds FALSE at location: 0
    service name: SYS$USERS
    client details:
      O/S info: user: oracle, term: UNKNOWN, ospid: 19858
      machine: qdty1 program: oracle@qdty1 (J000)
    Current Wait Stack:
      Not in wait; last wait ended 0.043184 sec ago
    There are 997 sessions blocked by this session.
    Dumping one waiter:
      inst: 2, sid: 474, ser: 15675
      wait event: 'row cache lock'
        p1: 'cache id'=0xb
        p2: 'mode'=0x0
        p3: 'request'=0x3
      row_wait_obj#: 2550657, block#: 472192, row#: 0, file# 460
      min_blocked_time: 0 secs, waiter_cache_ver: 21515
    Wait State:
      fixed_waits=0 flags=0x21 boundary=0x0000000000000000/-1
    Session Wait History:
        elapsed time of 0.043295 sec since last wait
     0: waited for 'ksdxexeotherwait'
        =0x0, =0x0, =0x0
        wait_id=12076 seq_num=12077 snap_id=1
        wait times: snap=0.064887 sec, exc=0.064887 sec, total=0.064887 sec
        wait times: max=30.000000 sec
        wait counts: calls=0 os=0
        occurred after 0.045113 sec of elapsed time
     1: waited for 'ksdxexeotherwait'
        =0x0, =0x0, =0x0
        wait_id=12075 seq_num=12076 snap_id=1
        wait times: snap=0.084154 sec, exc=0.084154 sec, total=0.084154 sec
        wait times: max=30.000000 sec
        wait counts: calls=0 os=0
        occurred after 0.025841 sec of elapsed time
 ...
     7: waited for 'kcbzps'
        =0xc000000cd93ba5f8, =0xc000000d61d53ed8, =0x0
        wait_id=12069 seq_num=12070 snap_id=1
        wait times: snap=0.019558 sec, exc=0.019558 sec, total=0.019558 sec
        wait times: max=0.010000 sec
        wait counts: calls=1 os=1
        occurred after 0.000439 sec of elapsed time
     8: waited for 'kcbzps'
        =0xc000000cd93ba5f8, =0xc000000d61d53ed8, =0x0
        wait_id=12068 seq_num=12069 snap_id=1
        wait times: snap=0.019598 sec, exc=0.019598 sec, total=0.019598 sec
        wait times: max=0.010000 sec
        wait counts: calls=1 os=1
        occurred after 0.000400 sec of elapsed time
     9: waited for 'kcbzps'
        =0xc000000cd93ba5f8, =0xc000000d61d53ed8, =0x0
        wait_id=12067 seq_num=12068 snap_id=1
        wait times: snap=0.019518 sec, exc=0.019518 sec, total=0.019518 sec
        wait times: max=0.010000 sec
        wait counts: calls=1 os=1
        occurred after 0.000462 sec of elapsed time
	----------------------------------------
      SO: 0xc000000ce37d6588, type: 56, owner: 0xc000000d1b14b988, flag: INIT/-/-/0x00 if: 0x3 c: 0x3
       proc=0xc000000d19dd8368, name=transaction, file=ktccts.h LINE:410 ID:, pg=0
      (trans) flg = 0x00000001, flg2 = 0x00480000, flg3 = 0x00000000, prx = 0x0000000000000000, ros = 2147483647, crtses=0xc000000d1b14b988
      flg  = 0x00000001: ALC
      flg2 = 0x00480000: NIP DDID
      flg3 = 0x00000000:
      bsn = 0xc3f bndsn = 0xc3f spn = 0xc42
      efd = 86 rfd = 0 DID:
      file:kdpur.c lineno:672
      parent xid: 0x0000.000.00000000
      env [0xc000000ce37d69a0]: (scn: 0x0000.00000000  xid: 0x0000.000.00000000  uba: 0x00000000.0000.00  statement num=0  parent xid: 0x0000.000.00000000  st-scn: 0x0000.00000000  hi-scn: 0x0000.00000000  ma-scn: 0x0000.00000000  flg: 0x00000000)
      cev: (spc = 0  arsp = 0x0000000000000000  ubkds (ubk:tsn: 0 rdba: 0x00000000 flag:0x0 hdl:0x0000000000000000 addr:0x0000000000000000)  useg tsn: 0 rdba: 0x00000000
            hwm uba: 0x00000000.0000.00  col uba: 0x00000000.0000.00
            num bl: 0 bk list: 0x0)
            cr opc: 0x0 spc: 0 uba: 0x00000000.0000.00
      Begin scn:0x0000.00000000 uba:0x00000000.0000.00 ts:1531915382[07/18/2018 20:03:02]
      Undo blks: 0 recs: 0
      ccbstg: 0x00000000
      (enqueue) released enqueue or enqueue in flux
      lock_flag: 0x0, lock: 0xc000000ce37d6600, res: 0xc000000d639c0850
      own: 0xc000000d1b14b988, sess: 0xc000000d1b14b988, prv: 0xc000000ce37d6610
       xga: 0x0000000000000000, heap: UGA
      tsnl:0xc000000d3faca840 nent:0 nxt:0x0000000000000000
      Trans IMU st: 0 Pool index 65535, Redo pool 0xc000000ce37d6d48, Undo pool 0xc000000ce37d6e30
      Redo pool range [0x9ffffffffd2eb800 0x9ffffffffd2eb800 0x9ffffffffd2f0000]
      Undo pool range [0x9ffffffffd2e7000 0x9ffffffffd2e7000 0x9ffffffffd2eb800]
       chnf control flags 0x0         CHNF hwm uba uba: 0x00000000.0000.00
---------------------------
SO: 0xc000000d4919fca0, type: 78, owner: 0xc000000d1a92b3a8, flag: INIT/-/-/0x00 if: 0x3 c: 0x3
       proc=0xc000000cf9c84e10, name=LIBRARY OBJECT LOCK, file=kgl.h LINE:8547 ID:, pg=0

      LibraryObjectLock:  Address=c000000d4919fca0 Handle=c000000d369275a8 Mode=N CanBeBrokenCount=1 Incarnation=1 ExecutionCount=6

        User=c000000d1a92b3a8 Session=c000000d1a92b3a8 ReferenceCount=1 Flags=[0000] SavepointNum=5b3584ac
      LibraryHandle:  Address=c000000d369275a8 Hash=876a7296 LockMode=N PinMode=0 LoadLockMode=0 Status=VALD
        ObjectName:  Name=INSERT INTO DDL_EVENTS SELECT :B1 , SYSDATE, ORA_LOGIN_USER, ORA_DICT_OBJ_NAME, ORA_DICT_OBJ_OWNER, ORA_DICT_OBJ_TYPE, ORA_SYSEVENT, MACHINE, PROGRAM, OSUSER FROM SYS.DUAL, SYS.V_$SESSION WHERE SYS_CONTEXT('USERENV','SESSIONID' ) = AUDSID(+)
          FullHashValue=6727fe5ca5d3747056737161876a7296 Namespace=SQL AREA(00) Type=CURSOR(00) Identifier=2271900310 OwnerIdn=28
        Statistics:  InvalidationCount=3 ExecutionCount=18225022 LoadCount=16 ActiveLocks=26 TotalLockCount=577225 TotalPinCount=1
        Counters:  BrokenCount=1 RevocablePointer=1 KeepDependency=2 BucketInUse=17 HandleInUse=17 HandleReferenceCount=0
        Concurrency:  DependencyMutex=c000000d36927658(0, 8974, 0, 0) Mutex=c000000d369276d8(0, 2730455, 77, 0)
        Flags=RON/PIN/TIM/PN0/DBN/[10012841]
        WaitersLists:
          Lock=c000000d36927638[c000000d36927638,c000000d36927638]
          Pin=c000000d36927618[c000000d36927618,c000000d36927618]
          LoadLock=c000000d36927690[c000000d36927690,c000000d36927690]
        Timestamp:  Current=07-13-2017 04:32:02
        HandleReference:  Address=c000000d36927838 Handle=0000000000000000 Flags=[00]
        LibraryObject:  Address=c000000c1fe2d3b8 HeapMask=0000-0001-0001-0000 Flags=EXS[0000] Flags2=[0000] PublicFlags=[0000]
          ChildTable:  size='16'
            Child:  id='0' Table=c000000c1fe2e268 Reference=c000000c1fe2dcb0 Handle=c000000d36926d18
            Child:  id='1' Table=c000000c1fe2e268 Reference=c000000c1fe2df90 Handle=c000000d346fd7e0
            Child:  id='2' Table=c000000c1fe2e268 Reference=c000000b1156e508 Handle=c000000107388470
            Child:  id='3' Table=c000000c1fe2e268 Reference=c000000b1156e810 Handle=c000000d323962e8
        NamespaceDump:
          Parent Cursor:  sql_id=5cwvjc63qnwnq parent=c000000c1fe2d458 maxchild=4 plk=y ppn=n
Note:
从当前可以看出blocker session 的等待事件,正在执行的SQL ,及事务的状态及开始时间,正在执行insert into ddl_event, 接下来向上找PROCESSes 和call,以session SO的owner或proc 都可以。
PROCESS 1400: J000
 ----------------------------------------
 SO: 0xc000000d19dd8368, type: 2, owner: 0x0000000000000000, flag: INIT/-/-/0x00 if: 0x3 c: 0x3
 proc=0xc000000d19dd8368, name=process, file=ksu.h LINE:12616 ID:, pg=0
 (process) Oracle pid:1400, ser:53, calls cur/top: 0xc000000c7e64d6f0/0xc000000c7ea7f9d8
 flags : (0x0) -
 flags2: (0x1010), flags3: (0x10)
 intr error: 0, call error: 0, sess error: 0, txn error 0
 intr queue: empty
 ksudlp FALSE at location: 0
 (post info) last post received: 0 0 80
 last post received-location: kji.h LINE:3418 ID:kjata: wake up enqueue owner
 last process to post me: c000000cf9c7b7e0 1 6
 last post sent: 0 0 26
 last post sent-location: ksa2.h LINE:285 ID:ksasnd
 last process posted by me: c000000d61c888c8 3 6
 (latch info) wait_event=0 bits=0
 Process Group: DEFAULT, pseudo proc: 0xc000000d021268a8
 O/S info: user: oracle, term: UNKNOWN, ospid: 19858
 OSD pid info: Unix process pid: 19858, image: oracle@qdty1 (J000)
 Short stack dump:
ksedsts()+544<-ksdxfstk()+48<-$cold_ksdxdocmdmultex()+10832<-ksdxdocmdmult()+80
<-$cold_ksudmp_proc()+5264<-ksudss()+4176<-kqrigt()+4112<-$cold_kqrLockAndPinPo()+864<-kqrpre1()+7968<-kqrpre()+64<-kkdlobn2()+144<-$cold_kdpurts()
+3440<-kdpursp()+240<-ktsx_purge_bin()+560<-ktspnr_next()+5968<-ktrsexec()+1664<-ktspbmphwm()+2160<-ktspmvhwm()+96<-ktsp_bump_hwm()+464<-ktspgsp_main()
+3264<-kdtgsp()+2112<-kdtgsph()+1440<-kdtFlushBuf()+1040<-qerltcFlushKdtBuffer()+864<-qerltcEndLoadProcessing()+704<-qerltcFetch()+1808<-insexe()
+1584<-opiexe()+16192<-opipls()+4192<-opiodr()+2416<-rpidrus()+432<-skgmstack()+224<-rpidru()+224<-rpiswu2()+1120<-rpidrv()+2736<-psddr0()+496<-psdnal()+1136<-pevm_EXECC()+1312<-pfrinstr_EXECC()+144<-pfrrun_no_tool()+192<-pfrrun()+1728<-plsql_run()+1200<-peicnt()+608<-kkxexe()+1104<-opiexe()
+22416<-opiall0()+2640<-opikpr()+864<-opiodr()+2416<-rpidrus()+432<-skgmstack()+224<-rpidru()+224<-rpiswu2()+1120<-kprball()+2736<-kktextrg()+704<-kkttrex()+4080<-kktexeevt0()+1184<-kktexefrdevt()+608<-kktfrddltrg()+2064<-opiexe()+23168<-opiosq0()+6960<-opiall0()+4384<-opikpr()+864<-opiodr()+241
6<-rpidrus()+432<-skgmstack()+224<-rpidru()+224<-rpiswu2()+1120<-kprball()+2736<-kdpurtab()+1424<-$cold_kdpurts()+3792<-kdpursp()+
240<-ktsx_purge_bin()+560<-ktspnr_next()+5968<-ktrsexec()+1184<-ktspbmphwm()+2160<-ktspmvhwm()+96<-ktsp_bump_hwm()+464<-ktspgsp_main()+3264
<-kdtgsp()+2112<-kdtgsph()+1440<-kdtFlushBuf()+1040<-qerltcFlushKdtBuffer()+864<-qerltcEndLoadProcessing()+704<-qerltcFetch()+1808<-insexe()
+1584<-opiexe()+16192<-opipls()+4192<-opiodr()+2416<-rpidrus()+432<-skgmstack()+224<-rpidru()+224<-rpiswu2()+1120<-rpidrv()+2736<-psddr0()
+496<-psdnal()+1136<-pevm_EXECC()+1312<-pfrinstr_EXECC()+144<-pfrrun_no_tool()+192<-pfrrun()+1728<-plsql_run()+1200<-peicnt()+608<-kkxexe()+1104<-opiexe()+22416<-opiall0()+2640<-opikpr()+864<-opiodr()+2416<-rpidrus()+432<-skgmstack()+224<-rpidru()+224<-rpiswu2()+1120<-kprball()+2736<-kktextrg()
+704<-kkttrex()+4080<-kktexeevt0()+1184<-kktexefrdevt()+608<-kktfrddltrg()+2064<-opiexe()+23168<-opiosq0()+6960<-opipls()+7584
<-opiodr()+2416<-rpidrus()+432<-skgmstack()+224<-rpidru()+224<-rpiswu2()+1120<-rpidrv()+2736<-psddr0()+496<-psdnal()+1136
<-pevm_EXIM()+592<-pfrinstr_EXIM()+80<-pfrrun_no_tool()+192<-pfrrun()+1728<-plsql_run()+1200<-peicnt()+608<-kkxexe()+1104
<-opiexe()+22416<-opiodr()+2416<-rpidrus()+432<-skgmstack()+224<-rpidru()+224<-rpiswu2()+1120<-rpidrv()+2736<-rpiexe()+144
<-$cold_kkjex1e()+18176<-kkjsexe()+1424<-kkjrdp()+2336<-opirip()+1776<-opidrv()+1152<-sou2o()+256<-opimai_real()+352<-ssthrdmain(576<-main()+336<-main_opd_entry()+80
Note:
根据processes的信息能看到当前的进程号,当前的call调用和call stack信息,kqrpre()是申请row cache lock相关函数。接下来顺着call 找对象。
# CALL
 ----------------------------------------
 SO: 0xc000000c7ea7f9d8, type: 3, owner: 0xc000000d19dd8368, flag: INIT/-/-/0x00 if: 0x3 c: 0x3
 proc=0xc000000d19dd8368, name=call, file=ksu.h LINE:12620 ID:, pg=0
 (call) sess: cur c000000d1b14b988, rec c000000d1b14b988, usr c000000d1b14b988; flg:30 fl2:1; depth:0
 svpt(xcb:0x0000000000000000 sptn:0x2 uba: 0x00000000.0000.00)
 ksudlc FALSE at location: 0
 ----------------------------------------
 SO: 0xc000000c7ea761d8, type: 3, owner: 0xc000000c7ea7f9d8, flag: INIT/-/-/0x00 if: 0x3 c: 0x3
 proc=0xc000000d19dd8368, name=call, file=ksu.h LINE:12620 ID:, pg=0
 (call) sess: cur c000000d1b14b988, rec c000000d1b14b988, usr c000000d1b14b988; flg:8 fl2:1; depth:1
 svpt(xcb:0x0000000000000000 sptn:0x5f uba: 0x00000000.0000.00)
 ksudlc FALSE at location: 0
 ----------------------------------------
 SO: 0xc000000c7ea81108, type: 3, owner: 0xc000000c7ea761d8, flag: INIT/-/-/0x00 if: 0x3 c: 0x3
 proc=0xc000000d19dd8368, name=call, file=ksu.h LINE:12620 ID:, pg=0
 (call) sess: cur c000000d1b14b988, rec c000000d1b14b988, usr c000000d1b14b988; flg:8 fl2:1; depth:2
 svpt(xcb:0x0000000000000000 sptn:0xaf uba: 0x00000000.0000.00)
 ksudlc FALSE at location: 0
 ----------------------------------------
 SO: 0xc000000c7ea86098, type: 3, owner: 0xc000000c7ea81108, flag: INIT/-/-/0x00 if: 0x3 c: 0x3
 proc=0xc000000d19dd8368, name=call, file=ksu.h LINE:12620 ID:, pg=0
 (call) sess: cur c000000d1b14b988, rec c000000d1b14b988, usr c000000d1b14b988; flg:8 fl2:1; depth:3
 svpt(xcb:0xc000000cefa86040 sptn:0x20a uba: 0x00000000.0000.00)
 ksudlc FALSE at location: 0
 ----------------------------------------
 SO: 0xc000000c7ea88360, type: 3, owner: 0xc000000c7ea86098, flag: INIT/-/-/0x00 if: 0x3 c: 0x3
 proc=0xc000000d19dd8368, name=call, file=ksu.h LINE:12620 ID:, pg=0
 (call) sess: cur c000000d1b14b988, rec 0, usr c000000d1b14b988; flg:0 fl2:1; depth:4
 svpt(xcb:0xc000000cefa86040 sptn:0x214 uba: 0x00000000.0000.00)
 ksudlc FALSE at location: 0
 ----------------------------------------
 SO: 0xc000000c7ea8c318, type: 3, owner: 0xc000000c7ea88360, flag: INIT/-/-/0x00 if: 0x3 c: 0x3
 proc=0xc000000d19dd8368, name=call, file=ksu.h LINE:12620 ID:, pg=0
 (call) sess: cur c000000d630cbf10, rec c000000d630cbf10, usr c000000d1b14b988; flg:8 fl2:1; depth:5
 svpt(xcb:0xc000000cefa86040 sptn:0x219 uba: 0x00000000.0000.00)
 ksudlc FALSE at location: 0
 ----------------------------------------
 SO: 0xc000000c7ea8efe0, type: 3, owner: 0xc000000c7ea8c318, flag: INIT/-/-/0x00 if: 0x3 c: 0x3
 proc=0xc000000d19dd8368, name=call, file=ksu.h LINE:12620 ID:, pg=0
 (call) sess: cur c000000d630cbf10, rec c000000d1b14b988, usr c000000d1b14b988; flg:8 fl2:1; depth:6
 svpt(xcb:0xc000000ce37bfb48 sptn:0x24f uba: 0x00000000.0000.00)
 ksudlc FALSE at location: 0
 ----------------------------------------
 SO: 0xc000000c7c51d938, type: 3, owner: 0xc000000c7ea8efe0, flag: INIT/-/-/0x00 if: 0x3 c: 0x3
 proc=0xc000000d19dd8368, name=call, file=ksu.h LINE:12620 ID:, pg=0
 (call) sess: cur c000000d1b14b988, rec c000000d1b14b988, usr c000000d1b14b988; flg:8 fl2:1; depth:7
 svpt(xcb:0xc000000ce37bfb48 sptn:0xbf5 uba: 0x00000000.0000.00)
 ksudlc FALSE at location: 0
 ----------------------------------------
 SO: 0xc000000c7e64d6f0, type: 3, owner: 0xc000000c7c51d938, flag: INIT/-/-/0x00 if: 0x3 c: 0x3
 proc=0xc000000d19dd8368, name=call, file=ksu.h LINE:12620 ID:, pg=0
 (call) sess: cur c000000d1b14b988, rec 0, usr c000000d1b14b988; flg:0 fl2:1; depth:8 <<<<<<<<<<<<< DEPTH 8说明是递归了第9层
 svpt(xcb:0xc000000ce37bfb48 sptn:0xbfd uba: 0x00000000.0000.00)
 ksudlc FALSE at location: 0
 ----------------------------------------
 SO: 0xc000000d54226898, type: 75, owner: 0xc000000c7e64d6f0, flag: INIT/-/-/0x00 if: 0x1 c: 0x1
 proc=0xc000000d19dd8368, name=row cache enqueues, file=kqr.h LINE:2064 ID:, pg=0
 row cache enqueue: count=1 session=c000000d1b14b988 object=c000000d4d1f35b0, request=S
 savepoint=0xc42
 row cache parent object: address=c000000d4d1f35b0 cid=11(dc_objects)
 hash=cde9d4ee typ=21 transaction=0000000000000000 flags=00000000
 objectno=26440423 ownerid=36 nsp=1
 name=BIN$bARtuAoEVFfgVEgPz2hlMg==$0 own=c000000d4d1f3678[c000000d4d1f3678,c000000d4d1f3678] wat=c000000d4d1f3688[c000000d54226940,c000000d54226940] mode=N
 status=-/-/-/-/-/-/-/-/-
 request=S release=FALSE flags=a
 instance lock=QI cde9d4ee 6e02795b
 set=0, complete=FALSE
 data=
 00000024 001e4249 4e246241 52747541 6f455646 66675645 67507a32 686c4d67
 3d3d2430 01000000 00000000 00000000 00000000 00000000 00000000 00000000
 ......
Note:
我们找到了session正在执行递归了9层的call调用,在在申请S模式的row cache enqueues, 对象号是26440423,所有者ID是36,名为BIN$bARtuAoEVFfgVEgPz2hlMg==$0,没错!回收站对象,相信你应该想到了为什么会递归到它,申请并且还没有成功,下一步看是哪个会持有这个对象锁。以name或objectno为关键字搜索。其实通过hash查找可以LCK进程正在转换实例间该资源锁。
     ----------------------------------------
      SO: 0xc000000d4d1f3860, type: 29, owner: 0xc000000d1b9e61f0, flag: INIT/-/-/0x00 if: 0x1 c: 0x1
       proc=0xc000000d61c888c8, name=ges enqueues, file=kjl.h LINE:587 ID:, pg=0
      ----------enqueue c000000d4d1f3860------------------------
      lock version     : 1
      Owner inst       : 1
      grant_level      : KJUSERNL
      req_level        : KJUSERPR
      bast_level       : KJUSERNL
      notify_func      : 0000000000000000
      resp             : c000000d36175718
      procp            : c000000d1b9e61f0
      pid              : 5156
      proc version     : 0
      oprocp           : 0000000000000000
      opid             : 5156
      group lock owner : 0000000000000000
      xid              : 0000-0000-00000000
      dd_time          : 0.0 secs
      dd_count         : 0
      timeout          : 172.0 secs
      On_timer_q?      : Y
      On_dd_q?         : N
      lock_state       : OPENING CONVERTING
      ast_flag         : 0x0
      Open Options     :  KJUSERPROCESS_OWNED KJUSERCLIENTLOCK
      Convert options  : KJUSERNODEADLOCKWAIT KJUSERNODEADLOCKBLOCK KJUSERTRCCANCEL
      History          : 0x9a
      Msg_Seq          : 0x0
      res_seq          : 998
      valblk           : 0x00000000000000000000000000000000 .
      ----------resource c000000d36175718----------------------
      resname       : [0xcde9d4ee][0x6e02795b],[QI][ext 0x0,0x0]
      hash mask     : x3
      Local inst    : 1
      dir_inst      : 1
      master_inst   : 1
      hv idx        : 40
      hv last r.inc : 8
      current inc   : 8
      hv status     : 0
      hv master     : 0
      open options  :
      grant_bits    : KJUSERNL KJUSEREX
      grant mode    : KJUSERNL  KJUSERCR  KJUSERCW  KJUSERPR  KJUSERPW  KJUSEREX
      count         : 1         0         0         0         0         1
      val_state     : KJUSERVS_NOVALUE
      valblk        : 0xc000000000667d50c00000000050ba40 .f}PP@
      access_inst   : 2
      vbreq_state   : 0
      state         : x0
      resp          : c000000d36175718
      On Scan_q?    : N
      Total accesses: 506837
      Imm.  accesses: 5492
      Granted_locks : 1
      Cvting_locks  : 1
value_block:  c0 00 00 00 00 66 7d 50 c0 00 00 00 00 50 ba 40
      GRANTED_Q :
      lp c000000c84c5ba58 gl KJUSEREX rp c000000d36175718 [0xcde9d4ee][0x6e02795b],[QI][ext 0x0,0x0]
        master 1 owner 2  bast 0 rseq 612 mseq 0x10055 history 0xed8ded8d
        open opt  KJUSERNO_XID
      CONVERT_Q:
      lp c000000d4d1f3860 gl KJUSERNL rl KJUSERPR rp c000000d36175718 [0xcde9d4ee][0x6e02795b],[QI][ext 0x0,0x0]
        master 1 pid 5156 bast 0 rseq 998 mseq 0 history 0x9a
        convert opt KJUSERNODEADLOCKWAIT KJUSERNODEADLOCKBLOCK KJUSERTRCCANCEL

PROCESS 29: LCK0
  ----------------------------------------
  SO: 0xc000000d61c888c8, type: 2, owner: 0x0000000000000000, flag: INIT/-/-/0x00 if: 0x3 c: 0x3
   proc=0xc000000d61c888c8, name=process, file=ksu.h LINE:12616 ID:, pg=0
  (process) Oracle pid:29, ser:3, calls cur/top: 0xc000000cfb52c0b8/0xc000000cfb52c0b8
            flags : (0x6) SYSTEM
            flags2: (0x0),  flags3: (0x10)
            intr error: 0, call error: 0, sess error: 0, txn error 0
            intr queue: empty
    ksudlp FALSE at location: 0
  (post info) last post received: 0 0 26
              last post received-location: ksa2.h LINE:285 ID:ksasnd
              last process to post me: c000000d09ccb820 28 0
              last post sent: 0 0 240
              last post sent-location: kqr.h LINE:2233 ID:kqrbtm
              last process posted by me: c000000d09ccb820 28 0
    (latch info) wait_event=0 bits=0
    Process Group: DEFAULT, pseudo proc: 0xc000000d021268a8
    O/S info: user: oracle, term: UNKNOWN, ospid: 5156
    OSD pid info: Unix process pid: 5156, image: oracle@qdty1 (LCK0)
    Short stack dump:
ksedsts()+544<-ksdxfstk()+48<-ksdxcb()+3216<-sspuser()+688<-<-_poll_sys()+48<-_poll()+224<-ssskgxp_poll()+208<-sskgxp_selectex()+1872<-skgxpiwait()+9424<-skgxpwaiti()+976<-skgxpwait()+416<-ksxpwait()+2880<-$cold_ksliwat()+2288<-kslwaitctx()+304<-kslwait()+192<-ksarcv()+640<-ksbabs()+752<-kclabs()+400<-ksbrdp()+2736<-opirip()+1296<-opidrv()+1152<-sou2o()+256<-opimai_real()+352<-ssthrdmain()+576<-main()+336<-main_opd_entry()+80
Note:
从字面看应该是LCK已经发现了deadlock(猜测), 下面我们去同时间点另一个节点生成的systemstate dump查看刚才的BIN$XXX对象锁.
      ----------------------------------------
        SO: 0xc000000d4bef1a70, type: 75, owner: 0xc000000cd2882160, flag: INIT/-/-/0x00 if: 0x1 c: 0x1
         proc=0xc000000d11c9f608, name=row cache enqueues, file=kqr.h LINE:2064 ID:, pg=0
        row cache enqueue: count=8 session=c000000cfac55ee0 object=c000000d42c5f400, mode=X
        savepoint=0x60b
        row cache parent object: address=c000000d42c5f400 cid=8(dc_objects)
        hash=cde9d4ee typ=21 transaction=c000000cd2882160 flags=00002031
        objectno=26440423 ownerid=36 nsp=1
        name=BIN$bARtuAoEVFfgVEgPz2hlMg==$0        own=c000000d42c5f4c8[c000000d4bef1b18,c000000d4bef1b18] wat=c000000d42c5f4d8[c000000d42c5f4d8,c000000d42c5f4d8] mode=X
        status=EMPTY/DELETE/-/-/-/-/NEED_INV/-/-
        request=N release=TRUE flags=8
        instance lock=QI cde9d4ee 6e02795b
        set=0, complete=FALSE
        data=
...

----------------------------------------
        SO: 0xc000000d4d9b18f0, type: 79, owner: 0xc000000cd2882160, flag: INIT/-/-/0x00 if: 0x3 c: 0x3
         proc=0xc000000d11c9f608, name=LIBRARY OBJECT PIN, file=kgl.h LINE:8551 ID:, pg=0

        LibraryObjectPin: Address=c000000d4d9b18f0 Handle=c000000a179cf0e8 Mode=X ClusterLock=c000000d66961b08 User=c000000cfac55ee0 Session=c000000cfac5be40 Count=1 Mask=0709 Flags=[2000] SavepointNum=0x525
        LibraryHandle:  Address=c000000a179cf0e8 Hash=972dc3a9 LockMode=X PinMode=X LoadLockMode=0 Status=VALD
          ObjectName:  Name=ICDCCT.BIN$bARtuAoEVFfgVEgPz2hlMg==$0
            FullHashValue=30205d0384d4db1253717722972dc3a9 Namespace=TABLE/PROCEDURE(01) Type=TABLE(02) Identifier=26440423 OwnerIdn=36
          Statistics:  InvalidationCount=0 ExecutionCount=0 LoadCount=4 ActiveLocks=1 TotalLockCount=20 TotalPinCount=28
          Counters:  BrokenCount=1030 RevocablePointer=1 KeepDependency=0 BucketInUse=1387 HandleInUse=1387 HandleReferenceCount=0
          Concurrency:  DependencyMutex=c000000a179cf198(0, 0, 0, 0) Mutex=c000000a179cf218(0, 1754, 0, 0)
          Flags=PIN/TIM/PTM/FUL/FUP/[0c005881]
          WaitersLists:
            Lock=c000000a179cf178[c000000a179cf178,c000000a179cf178]
            Pin=c000000a179cf158[c000000a179cf158,c000000a179cf158]
            LoadLock=c000000a179cf1d0[c000000a179cf1d0,c000000a179cf1d0]
          Timestamp:  Current=NULL Previous=05-13-2018 00:06:01
          HandleReference:  Address=c000000a179cf2c8 Handle=c000000d4ed70c70 Flags=OWN[200]
          LockInstance:  id='LB30205d0384d4db12' GlobalEnqueue=0000000000000000 ReleaseCount=0
          PinInstance:  id='NB30205d0384d4db12' GlobalEnqueue=0000000000000000
          LibraryObject:  Address=c000000b75ac2a58 HeapMask=0000-0000-0000-0000 Flags=NEX/DRP[0040] Flags2=[0000] PublicFlags=[0040]
            DataBlocks:
              Block:  #='0' name=KGLH0^972dc3a9 pins=0 Change=NONE
                Heap=c000000a17212e68 Pointer=c000000b75ac2af8 Extent=c000000b75ac29d8 Flags=I/-/P/A/-/-
                FreedLocation=0 Alloc=1.554688 Size=3.976562 LoadTime=61784030550

# search 0xc000000cd2882160

	      ----------------------------------------
      SO: 0xc000000cd2882160, type: 56, owner: 0xc000000cfac55ee0, flag: INIT/-/-/0x00 if: 0x3 c: 0x3
       proc=0xc000000d11c9f608, name=transaction, file=ktccts.h LINE:410 ID:, pg=0
      (trans) flg = 0x08001603, flg2 = 0x00482000, flg3 = 0x00000000, prx = 0x0000000000000000, ros = 2147483647, crtses=0xc000000cfac55ee0
      flg  = 0x08001603: ALC TRN VUS VID USN DRT
      flg2 = 0x00482000: CCP NIP DDID
      flg3 = 0x00000000:
      bsn = 0x496 bndsn = 0x638 spn = 0x67d
      efd = 50 rfd = 0 DID:
      file:kdpur.c lineno:672
      parent xid: 0x0000.000.00000000
      env [0xc000000cd2882578]: (scn: 0x0e70.641f08e3  xid: 0x3033.012.0013a30b  uba: 0x00000000.0000.00  statement num=0  parent xid: 0x0000.000.00000000  st-scn: 0x0000.00000000  hi-scn: 0x0000.00000000  ma-scn: 0x0000.00000000  flg: 0x00000000)
      cev: (spc = 3622  arsp = 0xc000000cec00e7f8  ubkds (ubk:tsn: 4 rdba: 0x2e008be3 flag:0x8 hdl:0x0000000000000000 addr:0x0000000000000000)  useg tsn: 4 rdba: 0x01019ffd
            hwm uba: 0x2e008be3.1e70.5a  col uba: 0x00000000.0000.00
            num bl: 0 bk list: 0x0)
            cr opc: 0x0 spc: 3622 uba: 0x2e008be3.1e70.5a
      Begin scn:0x0e70.641f08e3 uba:0x2e008be3.1e70.5a ts:1531915382[07/18/2018 20:03:02]
      Undo blks: 1 recs: 1
      ccbstg: 0x00000000
      (enqueue) TX-30330012-0013A30B	DID: 0002-00B1-00003E22
      lv: 00 00 00 00 00 00 00 00 00 00 00 00 00 00 00 00  res_flag: 0x47
      mode: X, lock_flag: 0x0, lock: 0xc000000cd28821d8, res: 0xc000000d23958a18
      own: 0xc000000cfac55ee0, sess: 0xc000000cfac55ee0, proc: 0xc000000d11c9f608, prv: 0xc000000d23958a28


# search 0xc000000cfac55ee0

   ----------------------------------------
    SO: 0xc000000cfac55ee0, type: 4, owner: 0xc000000d11c9f608, flag: INIT/-/-/0x00 if: 0x3 c: 0x3
     proc=0xc000000d11c9f608, name=session, file=ksu.h LINE:12624 ID:, pg=0
    (session) sid: 6423 ser: 45747 trans: 0xc000000cd2882b70, creator: 0xc000000d11c9f608
              flags: (0x210041) USR/- flags_idl: (0x1) BSY/-/-/-/-/-
              flags2: (0x40009) -/-/INC
              DID: , short-term DID:
              txn branch: 0x0000000000000000
              oct: 2, prv: 0, sql: 0xc000000a46b81718, psql: 0xc000000a46b81718, user: 28/xxxx
    ksuxds FALSE at location: 0
    service name: SYS$USERS
    client details:
      O/S info: user: oracle, term: UNKNOWN, ospid: 18176
      machine: qdty2 program: oracle@qdty2 (J001)
    Current Wait Stack:
      Not in wait; last wait ended 0.029569 sec ago
    Wait State:
      fixed_waits=0 flags=0x21 boundary=0x0000000000000000/-1
    Session Wait History:
        elapsed time of 0.029602 sec since last wait
     0: waited for 'ksdxexeotherwait'
        =0x0, =0x0, =0x0
        wait_id=10573 seq_num=10574 snap_id=1
        wait times: snap=0.062345 sec, exc=0.062345 sec, total=0.062345 sec
        wait times: max=30.000000 sec
        wait counts: calls=0 os=0
        occurred after 0.007576 sec of elapsed time

# search 		 0xc000000d11c9f608

PROCESS 177: J001
  ----------------------------------------
  SO: 0xc000000d11c9f608, type: 2, owner: 0x0000000000000000, flag: INIT/-/-/0x00 if: 0x3 c: 0x3
   proc=0xc000000d11c9f608, name=process, file=ksu.h LINE:12616 ID:, pg=0
  (process) Oracle pid:177, ser:17, calls cur/top: 0xc00000015c404d38/0xc000000c94cb9308
            flags : (0x0) -
            flags2: (0x1010),  flags3: (0x10)
            intr error: 0, call error: 0, sess error: 0, txn error 0
            intr queue: empty
    ksudlp FALSE at location: 0
  (post info) last post received: 0 0 241
              last post received-location: kqr.h LINE:2237 ID:kqrbgl: compatible mode
              last process to post me: c000000d61c888c8 1 6
              last post sent: 0 0 26
              last post sent-location: ksa2.h LINE:285 ID:ksasnd
              last process posted by me: c000000d61c888c8 1 6
    (latch info) wait_event=0 bits=0
    Process Group: DEFAULT, pseudo proc: 0xc000000d021268a8
    O/S info: user: oracle, term: UNKNOWN, ospid: 18176
    OSD pid info: Unix process pid: 18176, image: oracle@qdty2 (J001)
    Short stack dump:
ksedsts()+544<-ksdxfstk()+48<-$cold_ksdxdocmdmultex()+10832<-ksdxdocmdmult()+80
<-$cold_ksudmp_proc()+5264<-ksudss()+4176<-kqrigt()+4112<-$cold_kqrLockAndPinPo()
+864<-kqrpre1()+7968<-kqrpre()+64<-kkdlobn2()+144<-$cold_kdpurts()+3440<-kdpursp()
Note:
可以看到1:9074 session的j000申请的BIN$bARtuAoEVFfgVEgPz2hlMg==$0 row cache enqueue正在被2:6423 session的j001进程以X模式占有,未且还没有释放,所以另1:9074就审请不成功,该事务同样也是8:03时间点的JOB进程调起。下面可以看j001 在执行什么sql, 什么call.
     ----------------------------------------

	# search SQL c000000a46b81718

	   SO: 0xc000000a26f226f8, type: 78, owner: 0xc000000d1a41db48, flag: INIT/-/-/0x00 if: 0x3 c: 0x3
       proc=0xc000000d61c92fa8, name=LIBRARY OBJECT LOCK, file=kgl.h LINE:8547 ID:, pg=0

      LibraryObjectLock:  Address=c000000a26f226f8 Handle=c000000a46b81718 Mode=N CanBeBrokenCount=1 Incarnation=1 ExecutionCount=1

        User=c000000d1a41db48 Session=c000000d1a41db48 ReferenceCount=1 Flags=[0000] SavepointNum=5b4f6ed5
      LibraryHandle:  Address=c000000a46b81718 Hash=876a7296 LockMode=N PinMode=0 LoadLockMode=0 Status=VALD
        ObjectName:  Name=INSERT INTO DDL_EVENTS SELECT :B1 , SYSDATE, ORA_LOGIN_USER, ORA_DICT_OBJ_NAME, ORA_DICT_OBJ_OWNER, ORA_DICT_OBJ_TYPE, ORA_SYSEVENT,
 MACHINE, PROGRAM, OSUSER FROM SYS.DUAL, SYS.V_$SESSION WHERE SYS_CONTEXT('USERENV','SESSIONID' ) = AUDSID(+)
          FullHashValue=6727fe5ca5d3747056737161876a7296 Namespace=SQL AREA(00) Type=CURSOR(00) Identifier=2271900310 OwnerIdn=28
        Statistics:  InvalidationCount=1 ExecutionCount=549887 LoadCount=6 ActiveLocks=6 TotalLockCount=516666 TotalPinCount=1
        Counters:  BrokenCount=1 RevocablePointer=1 KeepDependency=1 BucketInUse=3 HandleInUse=3 HandleReferenceCount=0
        Concurrency:  DependencyMutex=c000000a46b817c8(0, 6215, 0, 0) Mutex=c000000a46b81848(0, 2212023, 10, 0)
        Flags=RON/PIN/TIM/PN0/DBN/[10012841]
        WaitersLists:
          Lock=c000000a46b817a8[c000000a46b817a8,c000000a46b817a8]
          Pin=c000000a46b81788[c000000a46b81788,c000000a46b81788]
          LoadLock=c000000a46b81800[c000000a46b81800,c000000a46b81800]
        Timestamp:  Current=11-02-2017 17:12:54
        HandleReference:  Address=c000000a46b819a8 Handle=0000000000000000 Flags=[00]
        LibraryObject:  Address=c00000099c3b8860 HeapMask=0000-0001-0001-0000 Flags=EXS[0000] Flags2=[0000] PublicFlags=[0000]
          ChildTable:  size='16'
            Child:  id='0' Table=c00000099c3b9710 Reference=c00000099c3b9168 Handle=c000000a45aa83e8
            Child:  id='1' Table=c00000099c3b9710 Reference=c00000099c3b9448 Handle=c000000d28d500b0
            Child:  id='2' Table=c00000099c3b9710 Reference=c00000099e421e40 Handle=c000000a464b13e8
        NamespaceDump:
          Parent Cursor:  sql_id=5cwvjc63qnwnq parent=c00000099c3b8900 maxchild=3 plk=y ppn=n

 # search CALL 0xc00000015c404d38

 ----------------------------------------
 SO: 0xc000000c94cb9308, type: 3, owner: 0xc000000d11c9f608, flag: INIT/-/-/0x00 if: 0x3 c: 0x3
 proc=0xc000000d11c9f608, name=call, file=ksu.h LINE:12620 ID:, pg=0
 (call) sess: cur c000000cfac55ee0, rec c000000cfac55ee0, usr c000000cfac55ee0; flg:30 fl2:1; depth:0
 svpt(xcb:0x0000000000000000 sptn:0x2 uba: 0x00000000.0000.00)
 ksudlc FALSE at location: 0
 ----------------------------------------
 SO: 0xc000000c949106b0, type: 3, owner: 0xc000000c94cb9308, flag: INIT/-/-/0x00 if: 0x3 c: 0x3
 proc=0xc000000d11c9f608, name=call, file=ksu.h LINE:12620 ID:, pg=0
 (call) sess: cur c000000cfac55ee0, rec c000000cfac55ee0, usr c000000cfac55ee0; flg:8 fl2:1; depth:1
 svpt(xcb:0x0000000000000000 sptn:0x8b uba: 0x00000000.0000.00)
 ksudlc FALSE at location: 0
 ----------------------------------------
 SO: 0xc000000c94db2590, type: 3, owner: 0xc000000c949106b0, flag: INIT/-/-/0x00 if: 0x3 c: 0x3
 proc=0xc000000d11c9f608, name=call, file=ksu.h LINE:12620 ID:, pg=0
 (call) sess: cur c000000cfac55ee0, rec c000000cfac55ee0, usr c000000cfac55ee0; flg:8 fl2:1; depth:2
 svpt(xcb:0x0000000000000000 sptn:0xec uba: 0x00000000.0000.00)
 ksudlc FALSE at location: 0
 ----------------------------------------
 SO: 0xc000000c95de4fd0, type: 3, owner: 0xc000000c94db2590, flag: INIT/-/-/0x00 if: 0x3 c: 0x3
 proc=0xc000000d11c9f608, name=call, file=ksu.h LINE:12620 ID:, pg=0
 (call) sess: cur c000000cfac55ee0, rec c000000cfac55ee0, usr c000000cfac55ee0; flg:8 fl2:1; depth:3
 svpt(xcb:0xc000000cd2ad4428 sptn:0x252 uba: 0x00000000.0000.00)
 ksudlc FALSE at location: 0
 ----------------------------------------
 SO: 0xc00000015c3aa170, type: 3, owner: 0xc000000c95de4fd0, flag: INIT/-/-/0x00 if: 0x3 c: 0x3
 proc=0xc000000d11c9f608, name=call, file=ksu.h LINE:12620 ID:, pg=0
 (call) sess: cur c000000cfac55ee0, rec 0, usr c000000cfac55ee0; flg:0 fl2:1; depth:4
 svpt(xcb:0xc000000cd2ad4428 sptn:0x25c uba: 0x00000000.0000.00)
 ksudlc FALSE at location: 0
 ----------------------------------------
 SO: 0xc000000c94f16200, type: 3, owner: 0xc00000015c3aa170, flag: INIT/-/-/0x00 if: 0x3 c: 0x3
 proc=0xc000000d11c9f608, name=call, file=ksu.h LINE:12620 ID:, pg=0
 (call) sess: cur c000000cfac5be40, rec c000000cfac5be40, usr c000000cfac55ee0; flg:8 fl2:1; depth:5
 svpt(xcb:0xc000000cd2ad4428 sptn:0x261 uba: 0x00000000.0000.00)
 ksudlc FALSE at location: 0
 ----------------------------------------
 SO: 0xc00000015c486660, type: 3, owner: 0xc000000c94f16200, flag: INIT/-/-/0x00 if: 0x3 c: 0x3
 proc=0xc000000d11c9f608, name=call, file=ksu.h LINE:12620 ID:, pg=0
 (call) sess: cur c000000cfac5be40, rec c000000cfac55ee0, usr c000000cfac55ee0; flg:8 fl2:1; depth:6
 svpt(xcb:0xc000000cd2882160 sptn:0x49d uba: 0x00000000.0000.00)
 ksudlc FALSE at location: 0
 ----------------------------------------
 SO: 0xc00000015c486f18, type: 3, owner: 0xc00000015c486660, flag: INIT/-/-/0x00 if: 0x3 c: 0x3
 proc=0xc000000d11c9f608, name=call, file=ksu.h LINE:12620 ID:, pg=0
 (call) sess: cur c000000cfac55ee0, rec c000000cfac55ee0, usr c000000cfac55ee0; flg:8 fl2:1; depth:7
 svpt(xcb:0xc000000cd2882160 sptn:0x63d uba: 0x00000000.0000.00)
 ksudlc FALSE at location: 0
 ----------------------------------------
 SO: 0xc00000015c404d38, type: 3, owner: 0xc00000015c486f18, flag: INIT/-/-/0x00 if: 0x3 c: 0x3
 proc=0xc000000d11c9f608, name=call, file=ksu.h LINE:12620 ID:, pg=0
 (call) sess: cur c000000cfac55ee0, rec 0, usr c000000cfac55ee0; flg:0 fl2:1; depth:8
 svpt(xcb:0xc000000cd2882160 sptn:0x645 uba: 0x00000000.0000.00)
 ksudlc FALSE at location: 0
 ----------------------------------------
 SO: 0xc000000a27156670, type: 75, owner: 0xc00000015c404d38, flag: INIT/-/-/0x00 if: 0x1 c: 0x1
 proc=0xc000000d11c9f608, name=row cache enqueues, file=kqr.h LINE:2064 ID:, pg=0
 row cache enqueue: count=1 session=c000000cfac55ee0 object=c000000d43dbeec8, request=S
 savepoint=0x681
 row cache parent object: address=c000000d43dbeec8 cid=11(dc_objects)
 hash=a92c05bd typ=21 transaction=0000000000000000 flags=00000000
 objectno=26440455 ownerid=38 nsp=1
 name=BIN$bARtuAoBVF3gVEgPz2hlMg==$0 own=c000000d43dbef90[c000000d43dbef90,c000000d43dbef90] wat=c000000d43dbefa0[c000000a27156718,c000000d4acf2fa0] mode=N
 status=-/-/-/-/-/-/-/-/-
 request=S release=FALSE flags=a
 instance lock=QI a92c05bd 955d5c35
 set=0, complete=FALSE
 data=
 00000026 001e4249 4e246241 52747541 6f425646 33675645 67507a32 686c4d67
Note:
节点2的6423会话J001正在以S模式申请BIN$bARtuAoBVF3gVEgPz2hlMg==$0的row cache enqueuue. 再继续以它为关键字查。
# node1 SSD TRACE search BIN$bARtuAoBVF3gVEgPz2hlMg==$0
      ----------------------------------------
        SO: 0xc000000d51d61560, type: 75, owner: 0xc000000ce37bfb48, flag: INIT/-/-/0x00 if: 0x1 c: 0x1
         proc=0xc000000d19dd8368, name=row cache enqueues, file=kqr.h LINE:2064 ID:, pg=0
        row cache enqueue: count=9 session=c000000d1b14b988 object=c000000d4a503ca8, mode=X
        savepoint=0xbbe
        row cache parent object: address=c000000d4a503ca8 cid=8(dc_objects)
        hash=a92c05bd typ=21 transaction=c000000ce37bfb48 flags=00002031
        objectno=26440455 ownerid=38 nsp=1
        name=BIN$bARtuAoBVF3gVEgPz2hlMg==$0        own=c000000d4a503d70[c000000d51d61608,c000000d51d61608] wat=c000000d4a503d80[c000000d3ace4558,c000000d3a862708] mode=X
        status=EMPTY/DELETE/-/-/-/-/NEED_INV/-/-
        request=N release=TRUE flags=8
        instance lock=QI a92c05bd 955d5c35
        set=0, complete=FALSE
        data=
Note:
根据proc=0xc000000d19dd8368可以找到进程就是1节点刚才的9074会话的J000进程,同时它又再以mode=X 模式占有。到这里就可以看到这个死锁情况:
1节点9074等待2:节点6423:
持有mode=X row cache enqueue(obj# 26440455 ICDSR.BIN$bARtuAoBVF3gVEgPz2hlMg==$0) ,正在以mode=S请求row cache enqueue(obj# 26440423 ICDCCT.BIN$bARtuAoEVFfgVEgPz2hlMg==$0)
2节点6423等待1节点9074:
持有row cache enqueue(obj# 26440423 ICDCCT.BIN$bARtuAoEVFfgVEgPz2hlMg==$0) mode=X,正在以mode=S请求row cache enqueue(obj# 26440455 ICDSR.BIN$bARtuAoBVF3gVEgPz2hlMg==$0)
把我们的发现反馈给Oracle SR后,Oracle方面认为目前版本已经不能再新开BUG,只在已知BUG中发现2个相似但又不同的BUG:
Bug 13387978 – Sessions running TRUNCATE causing a deadlock, even if the constraints are disabled ( Doc ID 13387978.8 )
Bug 12351027 – Redefinition causing deadlock between “row cache lock” and “library cache lock” ( Doc ID 12351027.8 )
上面的BIN$XX对象是kqrLockAndPinPo()函数调用,所以以ksliwat()+3328<-kslwaitctx()+304<-kqrigt()+1664<-$cold_kqrLockAndPinPo()+864<-kqrpre1()+1824<-kqrpre CALL stack 查询又和2319957.1 描述有点像,但是11204 版本。 至于是哪个BUG现在没法确定。
但是为什么会有drop table BIN$xx purge的操作呢? 当前想到的也只有空间紧张问题。
BUG也是在特定的场景触发,我们查到这里已经有几种方法可以尝试绕开这个局面,来规避这个未知BUG。
如:
- 减少多会话的DDL操作
- 手动清空回收站
- 为表空间增长可用空间
其它这个系统从我们DDL trigger捕获的操作,有的表1小时能truncate 1万5千多次,以建议看是否可以用全局临时表,但不清楚为什么会有这样的设计。
自动清理回收站
当发现有空间紧张时会自动释放回收站里的对象, 使用的是FIFO先进先出的算法, 以下情况会回收再利用表空间的对象
- o A user creates a new table or adds data that causes their quota to be exceeded.
o The tablespace needs to extend its file size to accommodate create/insert operations.
sometimes the tablespace is have big available space, but fragmentation can also occur.
空间的申请优先级
- 同表空间非回收站的可用空间
- 同表空间回收站的对象再利用
- 自动扩展数据文件(如果可以)
模拟方法
- create table a table on users tablespace and check table size
- create a tablespace size same as #1 table size
- move #1 table to #2 new tablespace
- drop table #1 in recyclebin
- enable 10046 trace
- create a new table on #2 tablespace
- view 10046 trace contain “drop table BIN$xxx purge” recursive sql
为什么hangmanager 没有自动解锁
Hang Manager是从10.2被引进的,用于是检测和处理hang问题。随着版本的增加功能也不断完善增强。在当前的数据库版本中HM在发现hang或死锁后尝试启用dia0进程去kill 堵塞者的会话和进程。
# dia0 trace file
Fail to allocate buffer due to incompletion of previous mcpy
mbal: buffer allocation to node 0 failed
kjzh_slave_workq_chk: can't allocate KJZG buffer, not-ini
TotalCPUTm:26840 ms TotalRunTm:432030 ms %CPU: 6.21%
DIAG detaches from KGXGN service
error 32737 detected in background process
OPIRIP: Uncaught error 447. Error stack:
ORA-00447: fatal error in background process
ORA-32737: Hang analysis aborted due to failed memory allocation
Note:
这个版本又命中了一个BUG,且11.2.0.3.8高一个小版本就已修复。
Bug 12744759 DIA0 process fails with “Fail to allocate buffer due to incompletion of previous mcpy”
Summary:
两个同时启动的JOB, truncate 了不同的对象DDL, 递归触发了DDL trigger的审计操作,在insert DDL日志表时,遇到了回收站空间再利用,再次递归触发了drop table BIN$ purge, 又属于DDL操作, 并且申请的回收站对象的row cache enqueue时,在2个跨实例会话互相等待对方持有对象lock造成死锁,死锁原因已是未知BUG, 同时HM进程的diag 进程又遇到了另一个bug 而反复重启,无法分析处理hang进程。因2个JOB的死锁后期又出现了其它进程在SQL解析的级联堵塞问题。手动解锁阻塞进程即可恢复。

 微信扫一扫,打赏作者吧~
对不起,这篇文章暂时关闭评论。